
Australian housing market valuation May 2023 detail

Damien Klassen
by Damien Klassen
May 2, 2023

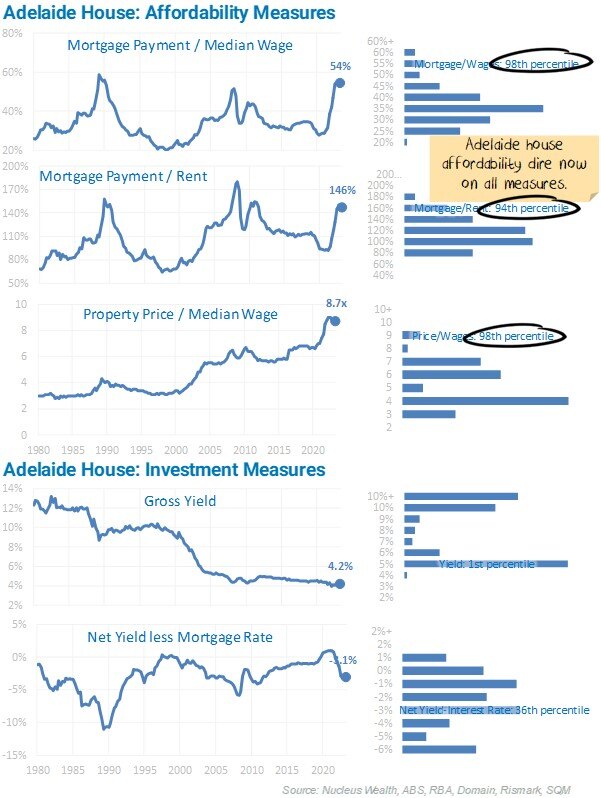
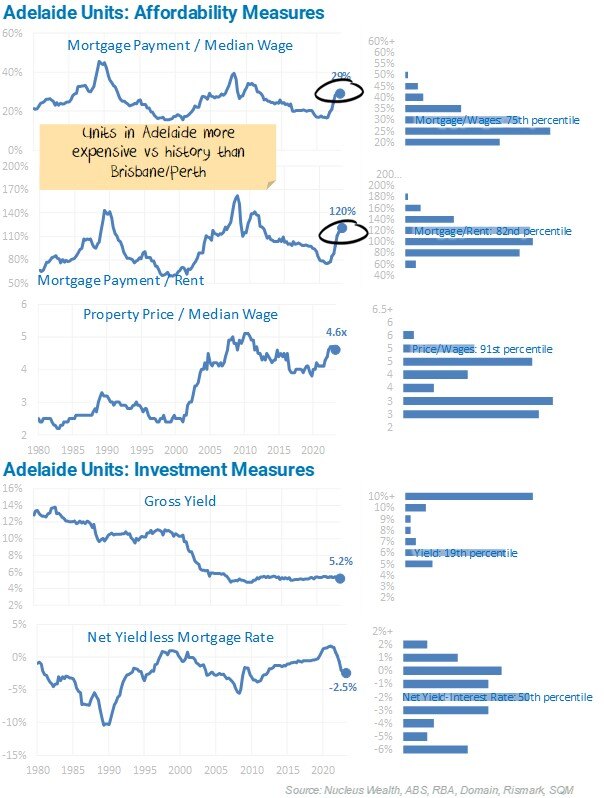
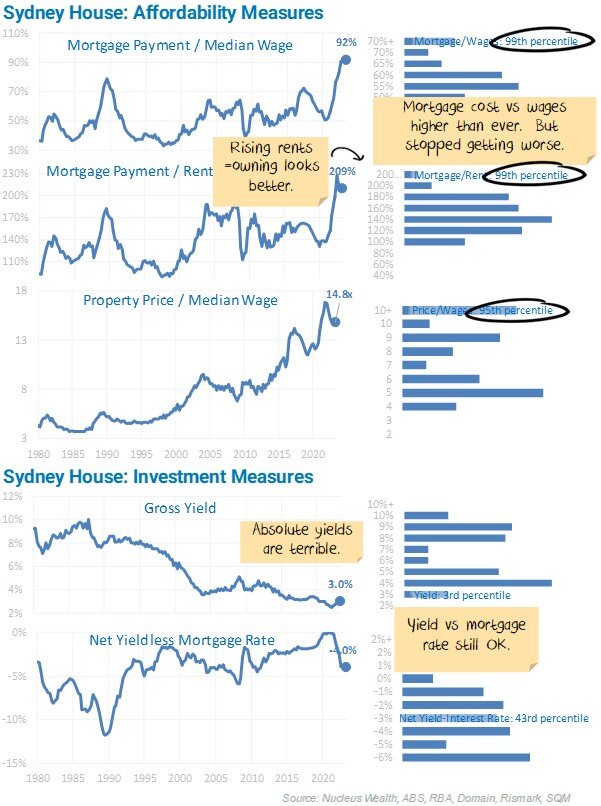
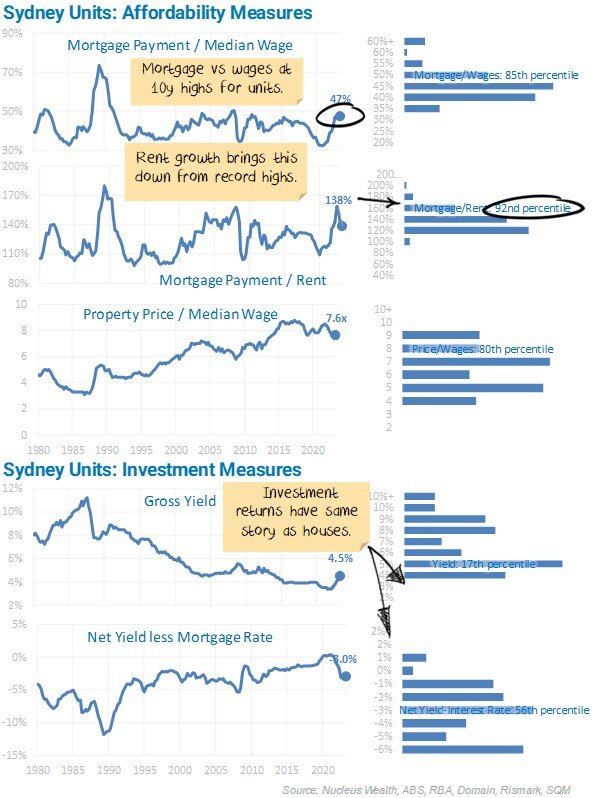
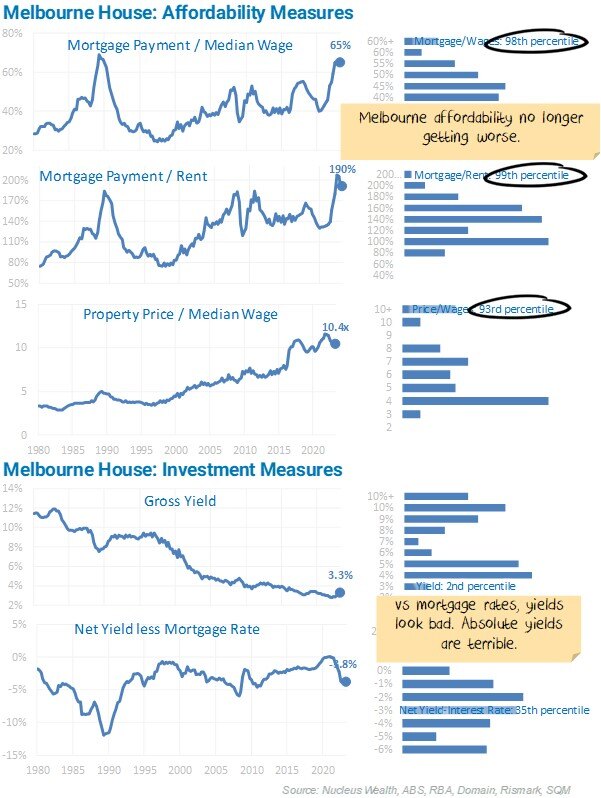
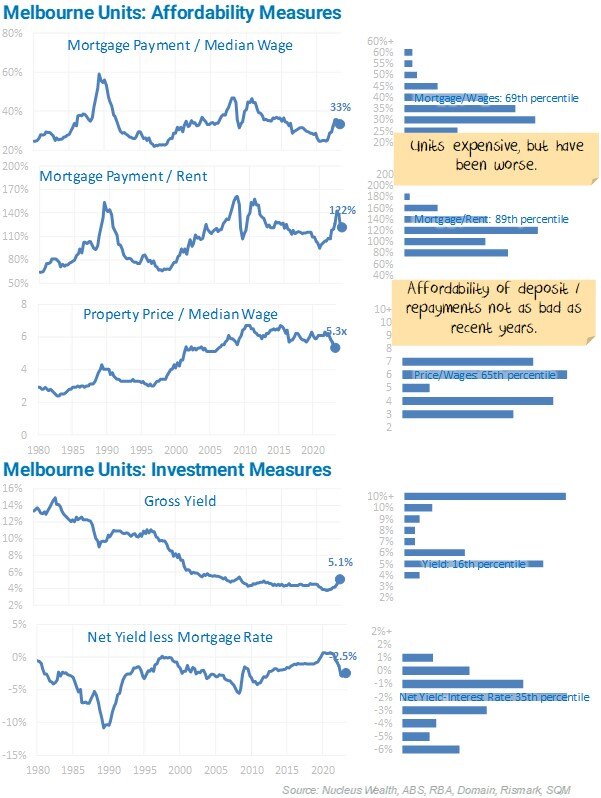
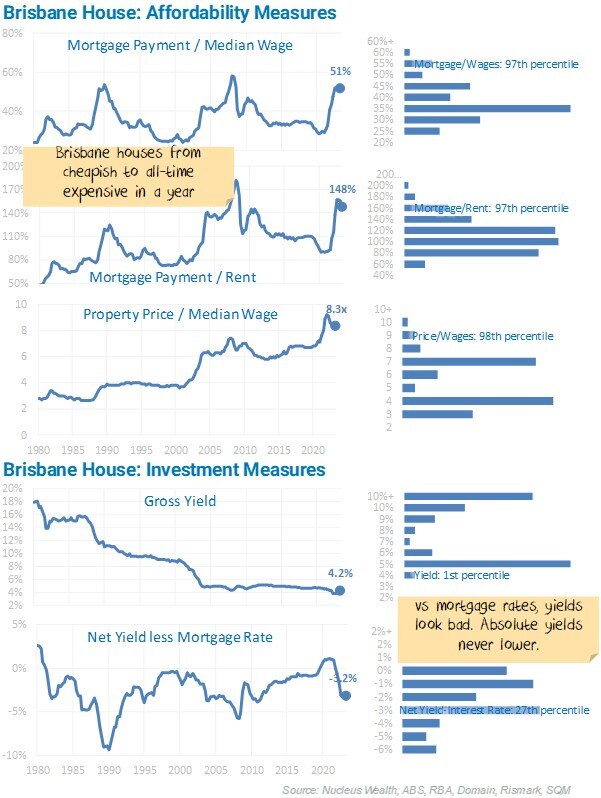
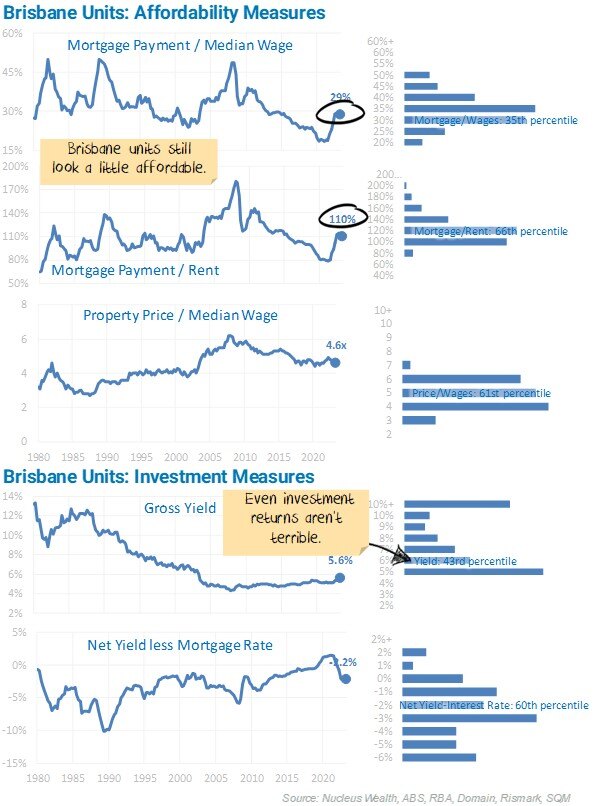
This page contains each chart from the latest property market update. See residential real estate for the forecasting methodology. Within all cities, a clear divergence is occurring between houses and units. 

[tabgroup title="City Valuation Detail" style="tabs"] [tab title="Sydney"]

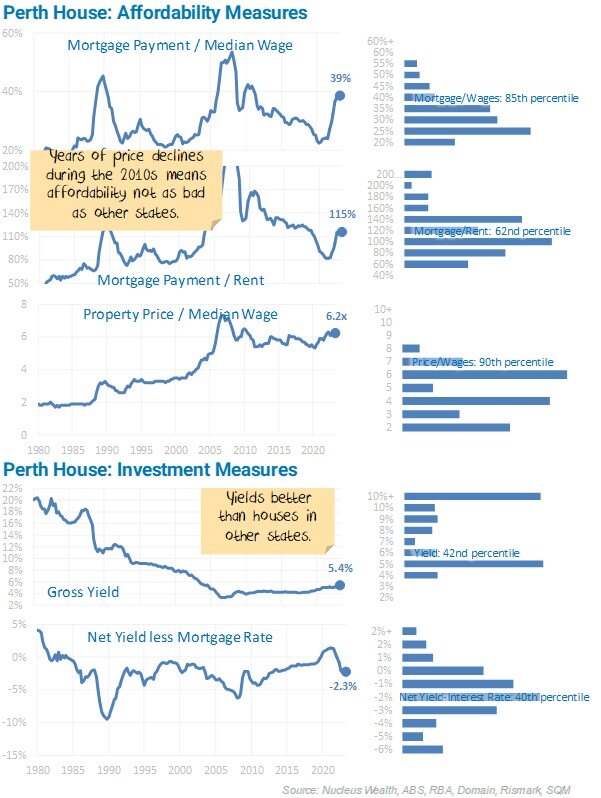
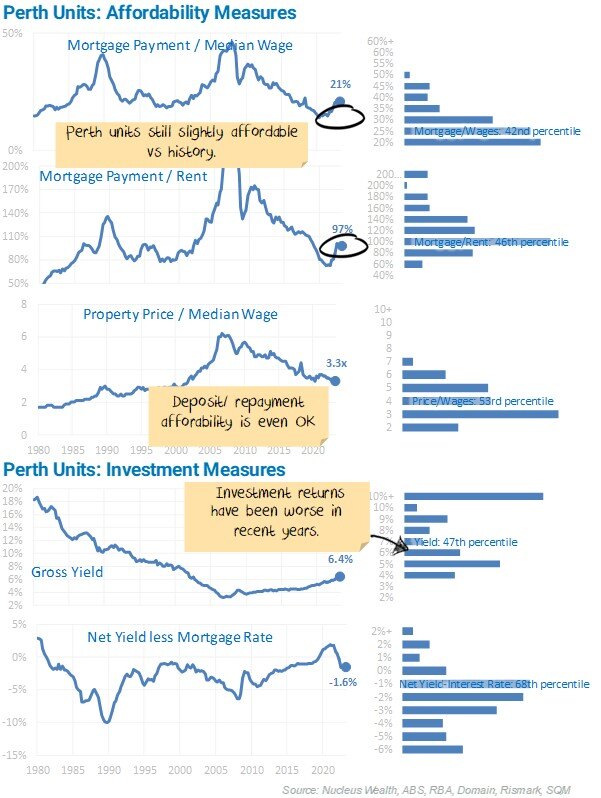
The left chart shows each of the ratios used for forecasting in the property calculator over 40 years. The histogram on the right shows the distribution of the same ratio over the 40 years.

Sydney House Affordability Measures

Sydney Units Affordability Measures [/tab] [tab title="Melbourne"]

The chart on the left shows how each of the ratios used for forecasting in the property calculator have changed over 40 years. The histogram on the right shows the distribution of the same ratio over the 40 years.

Melbourne House Affordability Measures

Melbourne Units Affordability Measures

 [/tab] [tab title="Brisbane"]

The chart on the left shows how each of the ratios used for forecasting in the property calculator have changed over 40 years. The histogram on the right shows the distribution of the same ratio over the 40 years.

Brisbane House Affordability Measures

Brisbane Units Affordability Measures [/tab] [tab title="Perth"]

The chart on the left shows how each of the ratios used for forecasting in the property calculator have changed over 40 years. The histogram on the right shows the distribution of the same ratio over the 40 years.

Perth House Affordability Measures

Perth Units Affordability Measures [/tab] [tab title="Adelaide"]

The chart on the left shows how each of the ratios used for forecasting in the property calculator have changed over 40 years. The histogram on the right shows the distribution of the same ratio over the 40 years. 

Adelaide House Affordability Measures

Adelaide Units Affordability Measures[/tab] [/tabgroup]