
Fossil fuels have a limited time as viable sources of energy. And I’m not talking about saving the planet or carbon taxes, simply economics.
Coal, gas, oil, all have economics based on a “scarcity curve” – the more we use them, the deeper we need to dig to find more and more expensive they become to extract. Solar and battery power is on a “technology curve” the more the world produces, the cheaper it becomes.
My view is that we will reach an “energy parity” where “technology curve” become an upper bound for the “scarcity” curve – the price of energy won’t exceed the cost of Solar+Batteries. Solar+Batteries are the “killer app” – extremely scalable once they reach an acceptable cost. The trillion dollar question is what is that price? If it can be reached in 5 years then there are major implications for stocks right now. If it is 20 years then investors can relax.
I’m not relaxed.
All the current trends point to energy parity being sooner rather than later for electricity. Oil has different issues – backup generation is being disrupted right now, cars will take longer, I’ll deal with oil separately.
The Numbers
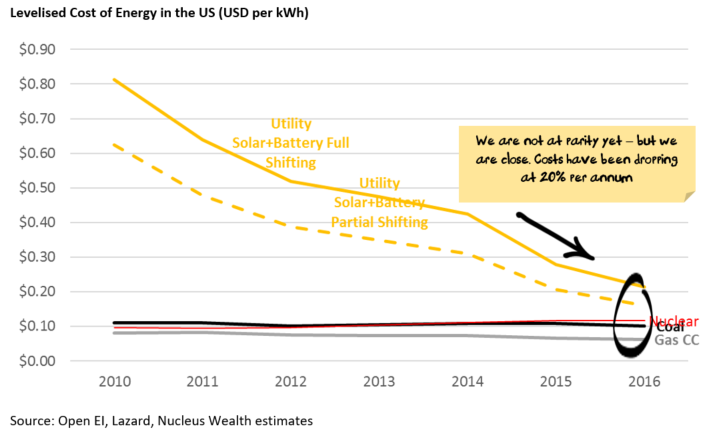
There are a few big picture numbers that you should be aware of. All numbers are USD/kWh for international comparability and expressed as “levelised cost of energy” which tries to adjust for the up-front cost of building power plants or solar arrays, the different lives of assets and tax issues. So the numbers rely on a lot of assumptions and should be treated as approximate.
Utility Electricity numbers:
- Coal power: About $0.05 for the power plant operating costs plus $0.02 for coal (at $50/t) or $0.03 (at $100/t). So total cost = $0.07 to $0.08
- Gas power: About $0.02 for the power plant (combined cycle) operating costs plus $0.02 for gas (at $3/mmBtu) or $0.06 (at $9/mmBtu). So total cost = $0.04 to $0.08
- Oil power: About $0.23 from a diesel generator
- Solar: About $0.06. Higher in less sunny areas.
- Solar + battery: If you just want to shift some of the daytime into the evening peak then about $0.14. To get round the clock, around $0.18.
- The power of compounding: Costs have been decreasing about 20% per annum for both batteries and solar. If this continues then in 5 years the above solar+battery costs will be $0.05 and $0.06 respectively.
Retail Electricity numbers:
- Retail Prices: US, China, India about $0.15. Australia $0.20-$0.30. Japan $0.25. Europe $0.30 (varies widely – Germany = $0.40)
- Time of Day charging: The above charges are averages. Time of day charges vary widely, but Off-peak prices of less than $0.10 and peak prices greater than $0.40 are indicative of the range.
- Rooftop solar: About $0.14. Higher in less sunny areas.
- Rooftop Solar + battery: If you just want to shift some of the daytime into the evening peak then about $0.44. To get round the clock, around $0.59.
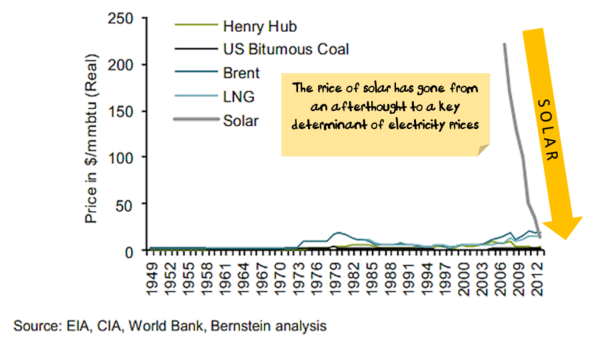
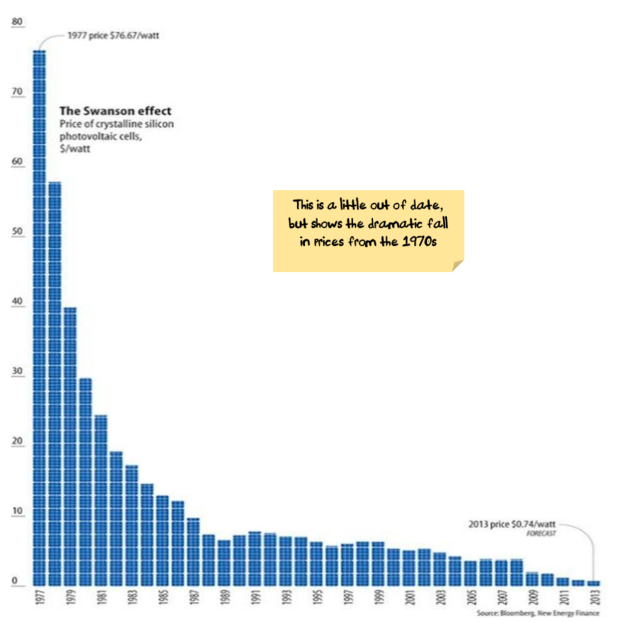
Solar Cost Trends
However you measure it, the cost of solar has fallen dramatically relative to other energy sources:

This graph way oversimplifies the issue, and there is a large asterisk on solar and wind costs in that solar only supplies power during the day, and wind is intermittent. What they need is something to store the power, and fortunately batteries are on the same type of price curve:

This is greatly aided by the fact that a few billion people worldwide carry a device with them everywhere that they would like to have a better battery life. So, the best minds that money can buy are pretty focused on the task. Battery prices will continue to fall.
There are other battery options other than the Lithium Ion batteries shown above. I have focussed on Lithium Ion but there may be another technology that supersedes it.
Putting batteries together with the solar gives us two options: (1) full shifting where we look at having a large battery in order to generate power throughout the night and (2) partial shifting where we look at having a battery to shift some of the power from the day to the evening peak use:
Solar Problems
The main issue is that solar produces power during the day, and so we look to be generating an excess of power during the day and a shortage at night.
Solar energy has a lower marginal cost (effectively zero marginal cost) than gas or coal, and so the “duck curve” (see below) will only get worse:

I expect this to be a permanent feature of the system going forward. i.e. electricity prices during the day to be much lower than evening prices.
Detailed Prices
First some disclaimers. I have greatly simplified all of these figures to illustrate the point. There is lots of debate about the exact levels for all of these prices because the calculation is not that simple, and the region or country influences the numbers. I have generally used the most recent reasonable price that I could find and where various numbers existed I took the lower price for all technologies.

There is a lot to unpack in this table.
Utility Solar at 6c is now in front of coal, and in front of natural gas at Australian and Asian prices. Natural gas is still cheaper in the US.
You will note that natural gas plants are cheaper than coal, but more sensitive to the price of natural gas than coal plants are to the cost of coal.
It also shows why the current high prices in Australia for natural gas are sowing the seeds for its own demise.
The battery prices shown here are for shifting solar in particular. This is not the same as the current energy crisis in South Australia – that is a matter of smoothing intermittent sources and has different economics. Gas peaking plants (which are used for intermittent power) run at about $0.20-$0.30 per kWh and the battery costs above would be higher for intermittent use. Most recent large-scale studies have shown that batteries are cost effective for the grid at the margin to smooth the peaks and troughs, but not for widespread adoption. I have little doubt that the 100-day Tesla batteries would have the same profile.
Future Prices
There is a range of different outcomes we could see for prices.
Below I have focused on two different scenarios, one where solar+battery costs fall at 10% per year for the next five years, another at 20%.
In the last 5 years costs have fallen around 20% per year. Given how low solar costs are, the more important assumption is battery prices.

Rooftop Solar
I have deliberately left Rooftop Solar out of the above table, as they are less comparable than you would think. Roof-top solar has costs of around $0.14 which is much higher than the costs above.
But that is not important. Rooftop solar is not competing with a coal plant, or even with utility solar.
Rooftop solar is competing with grid power + grid infrastructure. It is an important distinction.
I don’t care whether my rooftop solar produces cheaper than the local coal-fired power station, I care whether it produces at a cheaper rate than I pay for power – and it does:

The issue is that my panels produce power during the day when everyone else’s panels are also producing power, and so unless I use it myself to offset the above charge, I get paid a fraction of what the power company will charge my neighbour for using my spare electricity. Also, the peak rate (in the evening) for time of day pricing is much higher than during the day.
At $0.44 for partial shifting (which is basically generating enough power to get you through the evening peak), having some batteries is very close to being profitable for anyone on time of day charges. A lot of this price comes from the discount rate, so if you are prepared to accept a lower return (and lock in electricity prices) then partial shifting can be worth it at current prices.
But batteries aren’t yet a “no brainer” cheaper option.
Looking at the 10% cost reduction and 20% cost reduction scenarios again:

There are lots of questions that the above table raises. If everyone starts going off-grid who pays for the poles and wire, do we end up in a “death spiral” where more people leave the grid, raising the cost for those who remain which means more people leave etc.
All valid questions.
My best bet is that it is going to be a battle of vested interests. Richer people will leave the grid when it becomes economic (as they can afford the up front cost), leaving renters and the poor left paying higher bills to account for the transmission assets. Governments will have three options:
- Prevent retail electricity price rises, stand up for the poor and make the asset owners pay the cost of their mistaken investment
- Socialise the losses and bail out the transmission asset owners
- Let the asset owners raise prices, shift the cost of adjustment onto the poor
While option 1 would be my preferred choice, I have a sinking feeling that option 3 will be the path of least resistance. The lobbyists will no doubt be hard at work on option 2 in case any government have the fortitude to explore option 1.
There is lots of solar
This chart from the IEA has lots of problems, it is understates the effect of renewables by showing annual potential for renewables vs total potential for non-renewables, and then offsets that error in the other direction by grossly overstating solar.
However, the thrust is largely right: solar is a massive, largely untapped, source of energy.

Source: Perez, M. Perez, IEA (2009,2015)
Maybe there will be an alternative technology breakthrough which drives electricity prices lower more quickly. I’m not saying it isn’t possible. However, for investors the main game is solar – its very large and it has a history of steep cost reductions.
My take is that other renewable technologies will contribute to lower prices at the margin, but solar is the main issue for electricity costs.
Picking solar winners will be difficult
It is hard to pick solar winners – there are so many competing technologies that are improving, all with different economics:

Keep in mind that this chart is a comparison of conversion efficiency – not of economics. A 20% efficient (low cost) thin film technology that can be “painted” onto structures might be much cheaper per kW produced than a 46% multijuction cell.
Net effect is that you can try to invest in a manufacturer, but for all you know their technology will be superseded by a university somewhere.
Solar Resources
It matters whether you are in a sunny location or not.
Cities like L.A., Sydney, New Dehli will find solar costs 20% cheaper than somewhere like New York, Beijing, Tokyo as they simply get more sun. At the other end of the spectrum, London or Moscow get about half the solar resources of L.A. or Sydney:

Source: Solargis
You will also note from the above chart that solar resources are pretty good in most emerging countries.
The interesting thing is that developed markets generally have been falling per capita energy demand, emerging markets are where all the growth is – in most developed markets electricity use is falling on a per capita basis:

Thankfully (for anyone who believes climate change isn’t a Chinese conspiracy), as developing markets increase their energy capacity going forward, the economics are going to tilt more and more in favour of solar.
Summary
At the moment, it looks like 7-10 years until we hit parity if current cost reductions are maintained. And don’t sleep on rooftop solar + batteries – they are a lot more expensive than coal, but retail power prices are a lot more expensive than wholesale. There is a decent chance that rooftop solar + battery users going off-grid start a “death spiral” for electricity transmission.
Battery costs are the major determinant at this point – if the rate of improvement slows then it may take 15-20 years. My base case is that battery improvement will be sustained, but its far from a given – this is the assumption to watch.
I’m thinking that power prices during the day are going to continue to fall over the next few years as we end up with a surplus of power from renewables. This will actually drive the pick up in batteries – the bigger the difference between the day price and the evening price the bigger the incentive for batteries.
The US is not the market to watch – energy costs are lower there than almost any other developed market. A better indicator of the future will be developments in Europe.
So, how does this affect investments:
- Coal/Gas: I’m in no way saying that coal and gas will cease to be used when we hit parity, it is just that the price will be limited to no more than solar+batteries, and that cost will fall year after year. Any investment in these companies should be done with falling commodity price expectations – i.e. value them in run-off. There may be short-term shortages/price spikes, but these are selling opportunities. Increases in electric car penetration may stall the downward trend for a few years.
- Solar companies: Solar manufacturer are difficult – the technology is moving too fast to work out if there will be a “winner takes all”. Service providers to the solar industry are probably a better investment (if you can find one that’s not already very expensive). We have been kicking the tyres of some of the semi-conductor stocks that manufacture “commodity-type” parts for solar companies – not a sexy area of the market (and thin margins) but at the right price some of these stocks are interesting.
- Industrials: Companies that have high electricity bills during the daytime (or can shift costs to the daytime) will benefit. There are a number of European materials and refining companies that have struggled to compete US companies because of the lower-cost US energy.
- Oil: At the margin, less diesel will be used for power generation in remote areas. Expect this to continue. It is not a large part of the oil market, but it will mean oil demand will be weaker than they would have otherwise been.
- Electricity Transmission: Will they get bailed out, will they be allowed to increase prices to offset falling customers, or will they take the pain of the “death spiral”? It is a country by country decisions – lots of risk in this trade.
- Electricity Production: The toughest thing about an investment today for these companies is that your competitor who builds a solar array next year will have lower costs than you who built last year and so your competitor can handle lower electricity prices. Plus the regulatory risks from the “death spiral”. Another risky trade.
None of this relies on increased carbon taxes. Increased carbon taxes will bring forward the price parity point.
The information on this blog contains general information and does not take into account your personal objectives, financial situation or needs. Damien Klassen is an authorised representative of Nucleus Wealth Management, a Corporate Authorised Representative of Integrity Private Wealth Pty Ltd, AFSL 436298.