
August saw the market continue the recovery as investors cheered positive news of a potential COVID-19 treatment and welcomed a month-long succession of upbeat economic data. The month’s recovery was underpinned by a series of better than expected economic reports, including an increase in manufacturing activity, better-than-anticipated factory orders, and a lessening of new jobless claims as well as the Fed’s inflation policy shift, suggesting that interest rates may remain low for longer than expected. September has started more shakily with an early correction from the stellar run of tech-heavy Nasdaq Index, and emerging second wave COVID statistics weighing on the market.
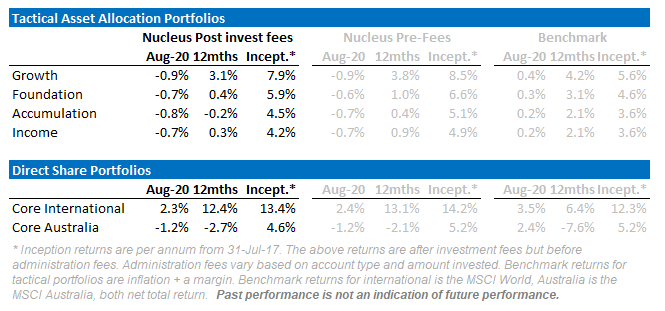
Our portfolios are not set up for rapidly rising markets, which capped our rise over August but has helped over September so far. Our international portfolio did manage a 2.3% increase but we have chosen not to chase this market and remain comfortable with our more defensive stance as we head towards the uncertainties of the 4th quarter. We continued to take profits on a number of our long term bond positions and park the proceeds in cash.

A fundamental valuation mistake
The 2008 financial crisis was, at least in part, due to a fundamental flaw in the pricing of Credit Default Swaps on housing lending. Analysts who justify the current rise in markets on falling interest rates are making a similar error.
A (very) brief history of credit default swap pricing
I won't go too deeply into the models, but you do need some background.
There is nothing intrinsically wrong with a credit default swap, or CDS.
The problem in the early 2000s was pricing models for credit default swaps assumed housing defaults were independent. i.e. that someone defaulting on a loan in Miami was unrelated to someone defaulting on a loan in San Francisco. In essence, the pricing models ignored the possibility of a housing market downturn that spanned the US.
Armed with this fallacy, banks could then "safely" lend far more than was reasonable and embarked on a massive lending spree.
Spoiler alert: the loans were not safe. The bankruptcies and the unwind of this lending was a significant cause of the financial crisis.
A (very) brief history of the lower interest rate argument
Falling interest rates have been credited by many with the rise in the stock market.
The operation is relatively mechanical, a discounted cash flow model takes future expected cash flows and then discounts them to give a current market value:
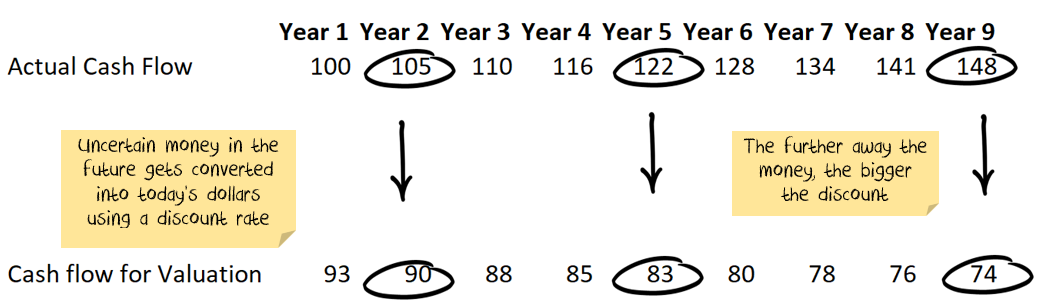
The mathematical effect of lower interest rates is that it increases the current market value.
We saw the effect Wednesday in Australia when lower interest expectations led to a broad market bounce.
Problem #1 with interest rate argument: Inflation
The most obvious problem with this analysis is that there is no context.
The only reason interest rates are low is because inflation is so low. i.e. declines in the growth rate of the cashflows simply due to lower inflation offset part of the benefit of lower interest rates.
Central banks simply cannot generate inflation, despite a dozen years of trying since the financial crisis.
Net effect: If inflation is going to be lower, then cash flows are also going to be lower, offsetting some of the valuation impact of lower interest rates.
Problem #2 with interest rate argument: Real growth
The same logic extends to the real (i.e. inflation-adjusted) growth rate of companies.
Not only is inflation low, but rock bottom interest rates reflect poor economic growth across the economy.
Net effect: If real economic growth is going to be lower, then cash flows are also going to be lower, offsetting some of the valuation impact of lower interest rates.
Problem #3 with interest rate argument: Distribution
In my view, discounted cash flow analysis is an excellent tool for evaluating bonds where the cashflows are known in advance.
That is not the case for shares.
With shares, each cash flow is uncertain. For a single period, we can express this as a distribution of likely outcomes:
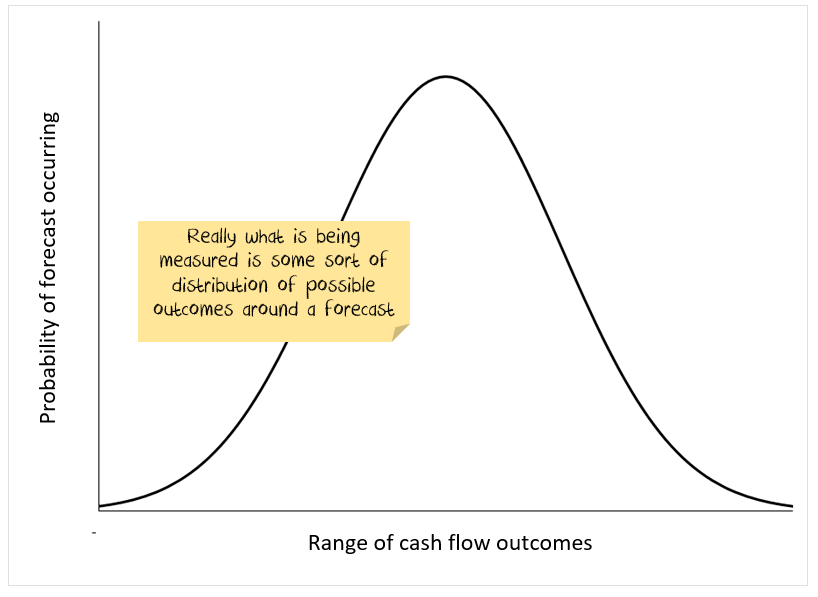
And then multiply this effect for every year where there is a forecast.
How do practitioners get around this uncertainty?
Poorly. To reflect the uncertainty of the earnings, analysts add a risk premium to the discount rate to drag the future value lower:
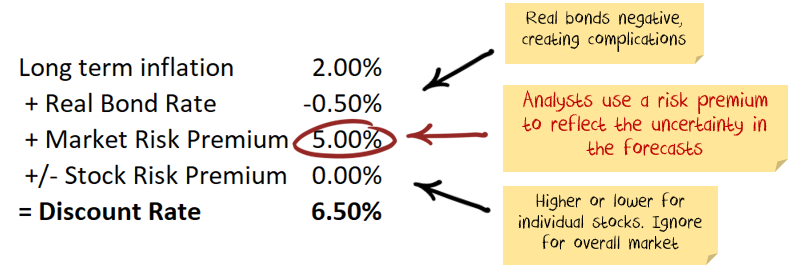
So, facing increased uncertainty, there should be some increase in the risk premium. to offset the fall in interest rates.
Net effect: If economic uncertainty is higher, then the market risk premium should also be higher, offsetting some of the valuation impact of lower interest rates.
Problem #4 with interest rate argument: Corporate debt
I won't go into the specifics, but the way most analyst's discounted valuation models work, a higher debt rate serves to decrease the discount rate and make the valuation higher.
There is a reasonable basis for this with low or average debt levels. Corporate debt is not low or average; it is high:
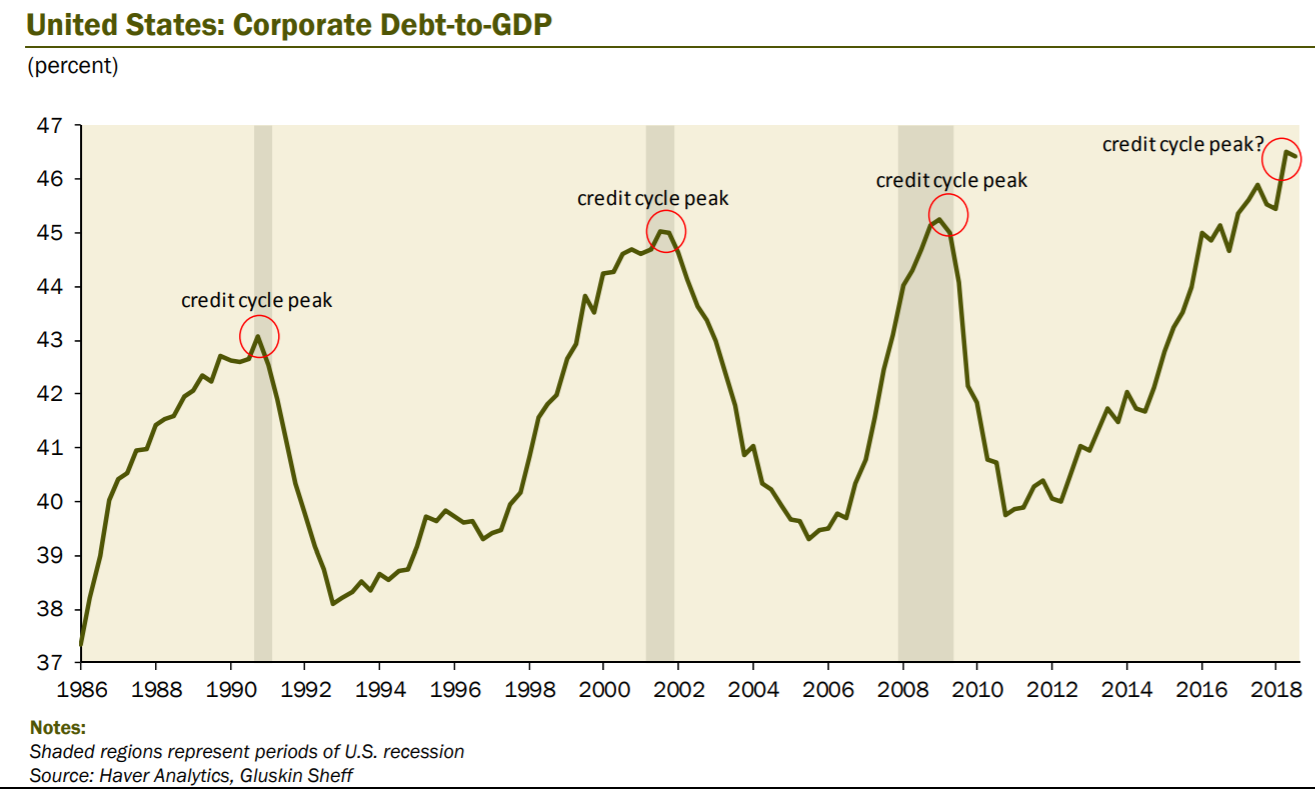
More debt changes the likely distribution of cash flows. It turns the distribution from a more even set of outcomes to give both a wider range and a higher likelihood that companies go broke:
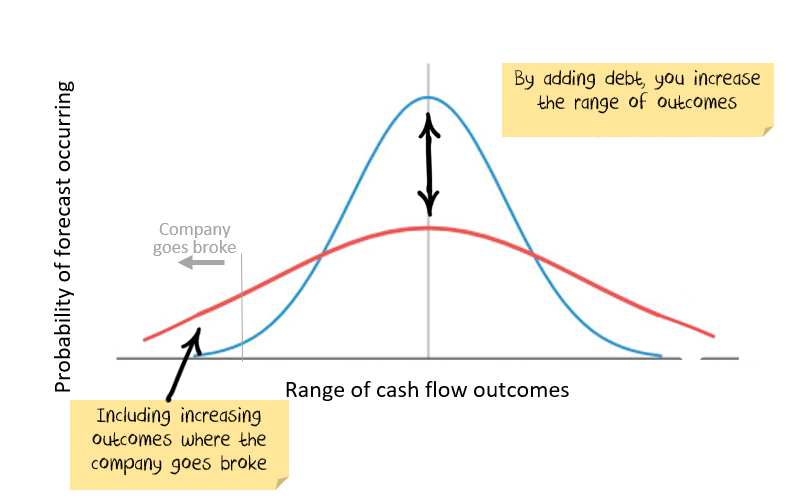
So, when there is a lot of debt and the growth rate falls, then the chance of companies going broke increases. i.e. the effect of lower growth on likely outcomes is different depending upon how much debt is in the system.
Net effect: If corporate debt is too high, then the market risk premium should also be higher, offsetting some of the valuation impact of lower interest rates.
Problem #5 with interest rate argument: Negative outcomes
People don't like to lose money. Numerous studies show the psychological pain of loss is higher than the pleasure of gains.
In a big picture sense, you will be prepared to pay a certain price for a volatile investment where you expect a return of 7%, but can reasonably expect the outcome to be between (say) 0% and 14%.
If you now lower the expected return to be 4%, the range is -3% to 11%. Arguably you should weight the greater risk of negative outcomes more heavily, and so increase the market risk premium.
Net effect: If expected returns are low, then the market risk premium should be higher, offsetting some of the valuation impact of lower interest rates.
Problem #6 with interest rate argument: Japan
This is complicated by the fact that Japan was in a stock market bubble as interest rates started to fall.
But, if anything, the experience in Japan was that lower interest rates led to lower share market valuations, not higher.
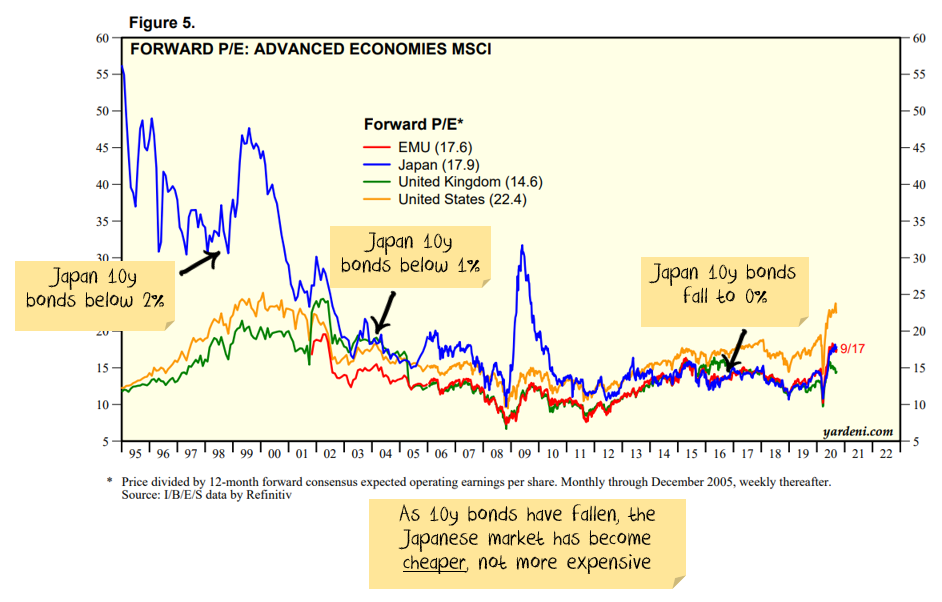
Net effect: Lower interest rates in Japan have led to lower valuations.
Exceptions to the rule
Every rule has an exception. In this case, if interest rates are to remain lower for longer but you can find a company with stable earnings, little debt and a decent growth rate, then there is an argument for higher prices driven by lower interest rates.
There are a reasonable number of stocks in the tech sector where this logic applies. There are also a large number of stocks in the tech sector trading as if it were true even though it isn't.
Final word on lower interest rates
To the surprise of some, more bad economic news does not mean that stocks should go up.
I disagree with, but can at least understand the arguments that say markets should be higher because either:
- governments and central banks have overstimulated in the short term and there is too much money in the system
- there will be a sudden recovery in the economy
But, I can't understand those who justify rising stock markets on the back of a worse outlook for long term interest rates.
Risk / Reward & peers
We recently passed our three year inception anniversary, which means the rating agencies such as Morningstar now publish our Risk metrics. Overall we are pleased with the results that highlight our ethos of striving for higher returns but not at the expense of accepting higher risk.
Below we have our annual returns versus the Standard Deviation of our returns, all calculated by Morningstar. The Standard Deviation of Returns is one of the few measures of Risk that can be used to compare funds. We have also plotted a sample of competitor funds.
Tactical Growth Risk/Return vs Peers

Source: Morningstar Fund Report
The graph shows Nucleus Wealth Tactical Growth portfolio has returned consistent above-average returns at a significantly lower Standard Deviation. The range of the three vs one year returns (shown as the ovals) also illustrates the lower volatility of our returns.
Core International Risk/Return vs Peers

Source: Morningstar Fund Report
Our Nucleus Wealth Core International Fund shows similar trends with attractive returns at a lower risk. The variability of returns is emphasised by the range of the three vs one year returns where Nucleus Wealth has the tightest grouping.
Bubbling along
Performance Detail
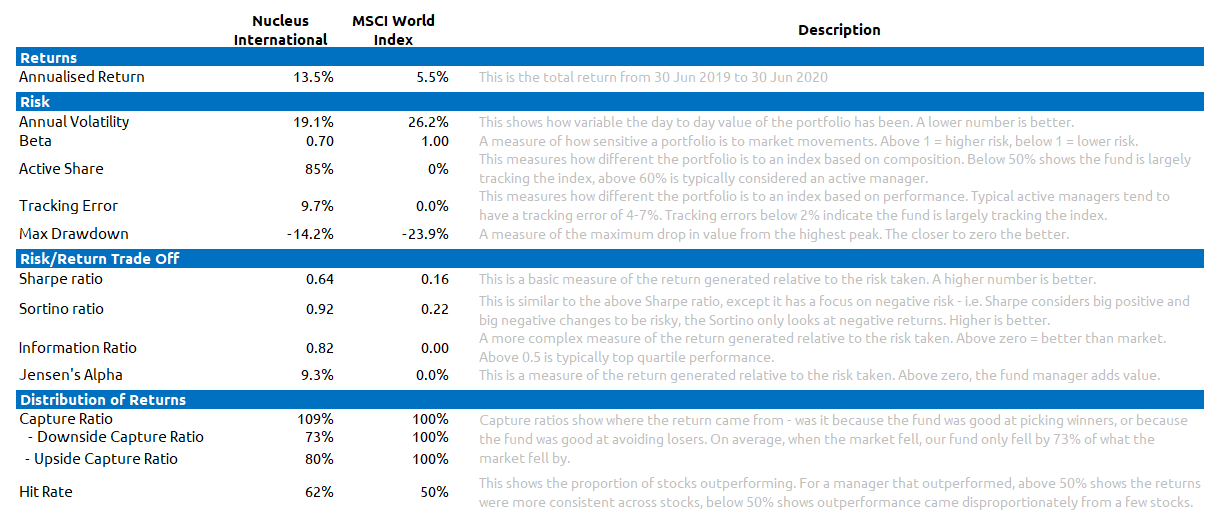
The charts below show some of the risk characteristics of our international fund over the 12 months:
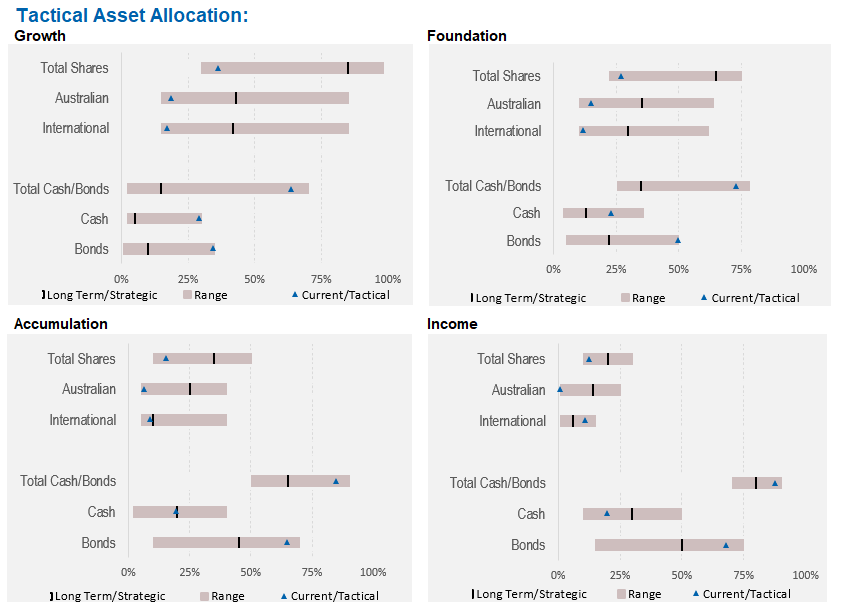
Asset Allocation
Our portfolios "went to ground" before the crisis hit, selling stocks and investing in bonds/cash/international currencies. All of our funds have a low weight to shares. This is a significant deviation and one that we have not undertaken lightly.
Wrap up
We changed most of our quant models a few months ago to put much less focus on the last 12 months of earnings, or the next year. The focus instead is on a mix of inflation-adjusted historical earnings and the earnings from the second year. The problem with this is:
- Historical earnings don't capture growth companies very well.
- Analysts are not very good at forecasting the second year of earnings in the best of times. We are not in the best of times.
Which is an indication of the environment. You have to understand the limits of your models. The key to navigating as we exit the eye of the storm will be to not lose track of the principles of good investment while changing models enough to reflect that times are not normal.
We have a shopping list of high-quality companies that we want to own for our investors at lower prices for the very long term. Which is easier said than done. We picked up a few in March, but the problem with these companies they also bounce back the fastest once panic subsides.
Given a toxic mix of low-interest rates, volatility and expensive markets, investors will need to be significantly more nimble than in the past.
Damien Klassen is Head of Investments at Nucleus Wealth.
Follow @DamienKlassen on Twitter or Linked In
The information on this blog contains general information and does not take into account your personal objectives, financial situation or needs. Past performance is not an indication of future performance. Damien Klassen is an authorised representative of Nucleus Wealth Management, a Corporate Authorised Representative of Nucleus Advice Pty Ltd - AFSL 515796.


