
December saw equities take off into a Santa rally, although the rising Australian dollar tempered international stocks for Australian investors. Expectations of a soft landing have become entrenched as falling inflation encourages markets to dream.

With that in mind, the key factor to watch in the coming months to tell if we are wrong or right is the change in corporate profitability. The recent reporting season in the US showed some signs of weakening earnings, but not enough to confirm our thesis yet. Earnings forecasts have been drifting lower, but the valuation effect of falling interest rates has overwhelmed any earnings issues.
Macro megatrends for 2024
There are three types of trends that investors should be aware of. Long, medium and short. Last month, we looked at the medium term trends. This month, we look at the long term trends.
Navigating the investment landscape requires understanding how different trends impact the market.
The short-term trends are the week-to-week and month-to-month trends that comprise much of the daily financial press. The mid-term trends are the ones that influence the sector and stock composition of your portfolios. The effects are measured in years rather than days.
Then are major macroeconomic trends. Demographics, debt cycles, and major social phenomena. But these are long-term. They tend to play out in 30-50 year cycles. They matter, but there typically aren't short-term implications. And these trends are more about whether you are generally looking for stocks/risk investments or bonds/defensive investments rather than individual stocks and sectors.
Most important? You need to be careful about buying in at the top of the hype cycle - ensure you're not overpaying for assets.
Long term trends
There are a number of big, long-term trends that investors need to be mindful of – like the demographic progression of the baby boomers. None of them are “drop everything and buy/sell” themes in the short term, but the effects are relentless, and these are the themes that will drive the decade-long trends.
Illustratively, they are like Ray Dalio's debt cycles, a combination of three different trends:
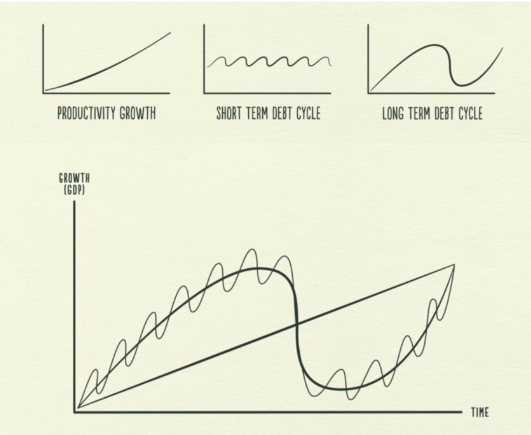
What matters is the steadily moving line, however this is the line that you are least able to see. It's effects disappear in the noise.
Long Term Trends: 1. Rising Inequality
Inequality has been rising for a number of decades:
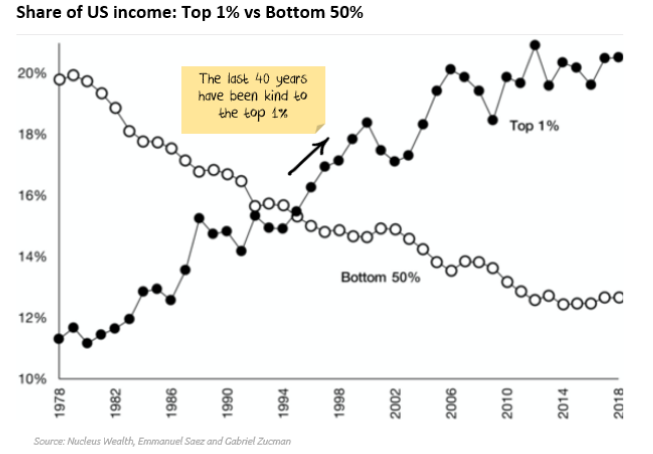
To confuse matters, global inequality has been falling as median incomes in places like China and India have narrowed the gap with developed countries. However, within countries the same trend is apparent – i.e. the 1% in China have done a lot better than the average Chinese citizen.
How does inequality manifest itself? In lots of ways, for the investor the two biggest issues are political instability and lack of demand.
Lack of demand was at the core of most of the world’s growth problem from 2010-2020. Inequality was not the only culprit, but it is a big one – give poor people more money and they spend it, give rich people more money and it is usually saved. It’s hard to see any reversal in inequality in the short term, quite possibly things will need to get worse before they get better. This lack of demand can be hidden by letting the 99% gear up, which has been the case for the last 40-50 years as well, but there is a limit to debt.
Political instability has been a feature of most elections over the last few years. Voters know something is wrong and that change is needed – they are just not sure what is wrong and that leaves them vulnerable to con men and demagogues. I’m thinking this is going to get worse before it gets better.
I suspect the rise of communism in the 50s-70s meant that capitalist countries worked hard to keep inequality from getting too extreme. The fall of communism since then has meant that its open slather on inequality – unfortunately the fact that capitalism won over communism has also been equated (in my view erroneously) with the view that we should let the 1% accrue as much as they can.
For a brief moment during the pandemic, inequality reversed. But we are now back to rising inequality.
Net effect: rising inequality has been a headwind to growth, and will probably continue on that path.
Long Term Trend 2: Baby Boomers – the pig in the demographic python
Following the second world war, most developed countries around the world experienced a baby boom.
What this has meant is that the proportion of workers in the economy has been growing for the last 40-50 years as this age group went from being dependent (under 18) to workers (18-34) to prime-age workers (34-54). The effect on the productivity and consumption patterns of the economy from this contingent are well documented – one investment theory is that you invest in whatever this age contingent needs next.
Unfortunately for those of us still working, what they need next is for younger workers to support them in retirement.
This means that while we have seen the ratio of workers to dependents rising in most countries for the last 40-50 years, that trend is changing as the boomers retire. The chart below is for the US – the increase in dependency is worse in Europe, Japan, China where population growth is lower.
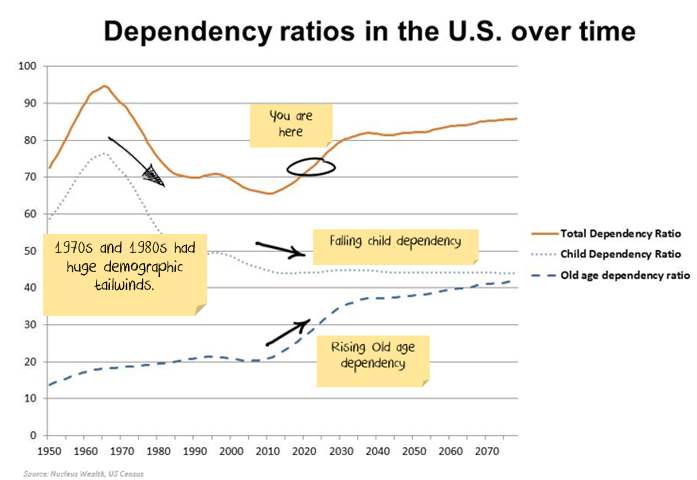
Immigration can slow the effects in some countries, but for most of the developed world the trend is unavoidable.
Net effect: falling dependency ratios have been a tailwind for growth, but are turning into a headwind.
Long Term Trend 3: Women in the workforce – Job Done?

Female participation in the workforce has been a key economic driver for a long time, moving women out of unpaid home duties and into the workforce has yielded numerous economic benefits. The above chart is US based, but again a similar trend in most developed countries exists.
It’s been a classic long-term trend; it can be knocked off-trend by medium-term issues like a recession but on the other side of the recession the trend re-emerges intact.
However, the 50 years of gains have come to an end. While women still face issues about equal pay and the number of women in senior positions, it would appear that (in aggregate) women are not being prevented from working, it is now a question of whether women want to work.
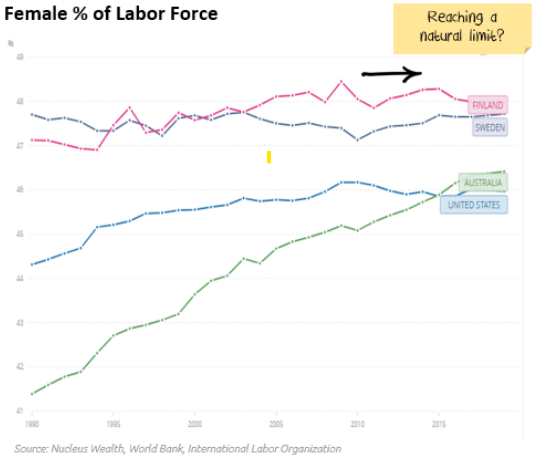
Net effect: increasing female participation has been a tailwind for growth, but has turned neutral.
Long Term Trend 4: Debt growth
I spoke a little above about the best way to raise demand when a small group of the population (the 1%) are taking the lion’s share of the economic benefits. The way to raise demand is for the 1% to lend the money to the 99% so that they can spend. And that is what has generally happened (from the Australian):

So, when does this end? I’m not sure – we don’t seem close. And the saying “you go broke slowly and then all at once” is probably instructive. There are two key ways to resolve over-indebtedness:
- Inflation: With lots of wage inflation, workers get more money which reduces the real value of their debts. This is relatively painless for most involved, and it is how central banks would like the transition to occur. The reality is that the methods tried to date haven’t created inflation, and Japan is a 20-year example of trying to create inflation but failing. In practice, for the 2010s central banks lowered interest rates to try to spark inflation, and in doing so they have increased the value of assets which has increased inequality. And so we ended up back to square one. The ironic thing is that we know exactly how to create inflation: print money and give it to poor people. As we saw during the pandemic. Economists generally don’t want this to happen because it usually gets out of control (Zimbabwe, Weimar Germany) and causes hyperinflation.
- Debt forgiveness/writeoffs: There have been lots of opportunities to do this – basically if you lent money to someone who can’t pay then you lose the money. It’s a great way of transferring assets out of the hands of the rich. Unfortunately what happened instead is that governments everywhere bailed out the banks whenever they stuffed up. The decision was made to “extend and pretend” in high-profile over-lending cases like Japan (zombie companies in the 1990s), the US (housing loans in 2008), Europe (Greek & peripheral debt in the last seven years) and China (the housing market in the early 2000’s and probably the housing market again in the not-to-distant future). I’m guessing most governments will continue to take a lot of pain over a long period of time rather than let lenders take responsibility for mistakes.
Net effect: increasing debt has been a tailwind for growth. It is still a tailwind, but we need to be cognizant that debt is reaching limits.
Long Term Trend 5: Death and taxes – inevitable for humans, but not for companies
Another long term benefit to the stock market has been the falling company tax rate.
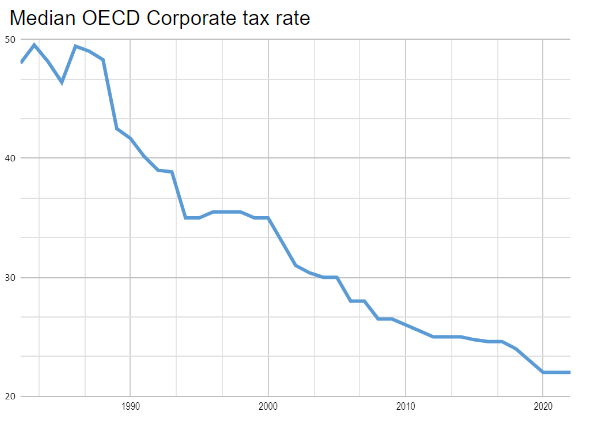
So, as you can see from the above chart, tax rates have basically halved over the last 30 years. Which is a big deal when it comes to earnings – my estimate is that somewhere between a 30% and 40% of real market EPS growth over the last 30 years has come from lower tax rate.
My rough, back of the envelope numbers for earnings growth over that time looks like this:
| Average Annual Real pretax EPS growth | 2.0% |
| + effect of tax cuts | 1.3% |
| + inflation | 2.8% |
| = Real annual EPS Growth | 6.1% |
So, this trend is not looking like ending anytime soon.
Is there likely to be a backlash at some stage? The moralist in me hopes so. The pragmatist doubts it is coming in the next five years.
Net effect: increasing falling taxes have been a tailwind for company profits, and probably remain a tailwind. Although the lion-share of the gains are probably behind us.
Long Term Trend 6: Increasing global trade
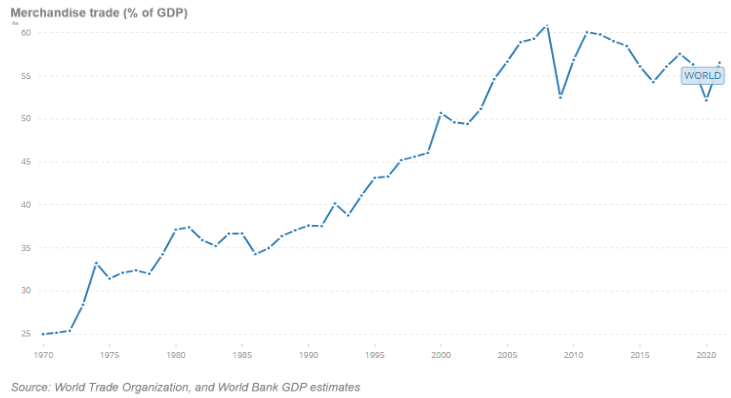
I am a believer in the magic of trade. A buyer and a seller come together, and both leave the transaction thinking that they got the better deal. Comparative advantage, specialisation, relative productivity – it all makes sense in terms of improving global well-being.
Where trade falls down is all about jobs. Like if you had a bunch of states in the US that specialised in manufacturing, and then you outsourced the manufacturing to Mexico and China but didn’t get the manufacturing workers into new jobs, leaving them enraged enough to vote for a reality TV star as president. Or if you were in Australia and sacrificed the bulk of your manufacturing workforce at the altar of the commodity sector and the never-ending Chinese boom, only then to realise that it wasn’t never-ending.
For companies in general, and multinationals in particular, growth in trade leads to growth in profits – companies are much better placed than individuals to exploit cost differentials across countries. It’s hard to estimate how much profit growth has come from increased global trade, my guess is that it is significantly greater than zero.
The danger over the next few years comes from the following chart – this shows how far trade fell in the 1930’s when the world turned against trade during the Great Depression.
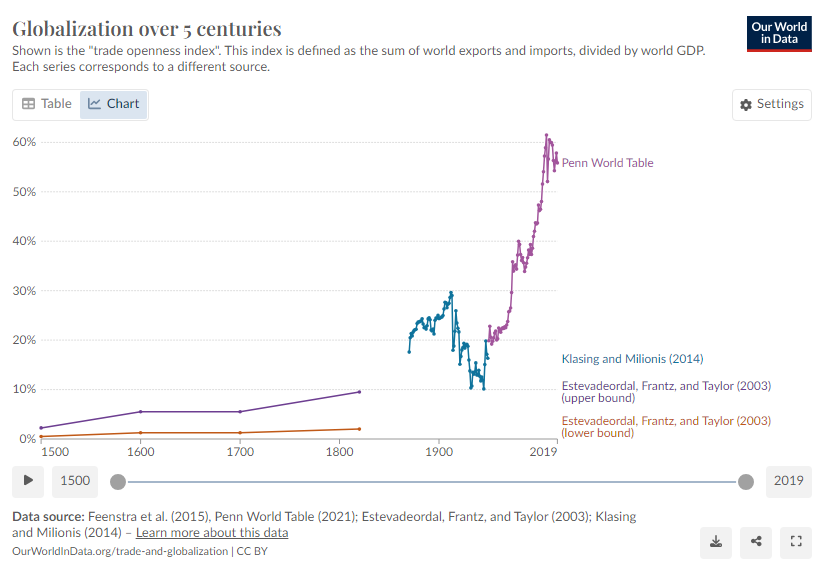
One of the only things that unites Democrats and Republicans in the US is the desire to reduce trade with China. The trend was already in place from Trump's tariffs, and has extended through COVID supply chain problems.
Its safe to say there will not be increased globalisation and the risks are tilted towards less. The risk to investors is that trade wars get worse and damage both world growth and company profits.
Net effect: increasing increasing trade was a 50 year tailwind for company profits. At best it has turned neutral, and there are downside risks.
Long Term Trend 7: Energy costs
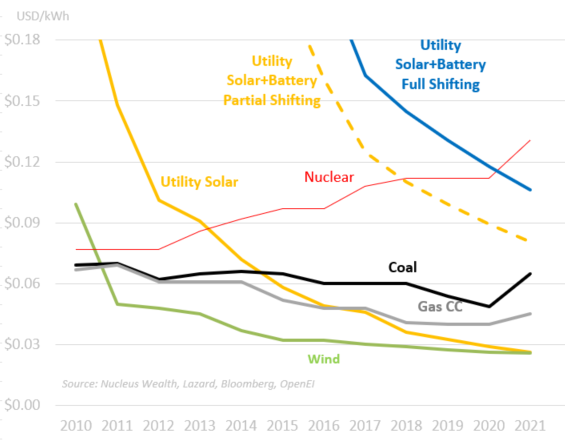
This is a different trend. We have seen decades of falling solar and battery costs. But they haven't mattered - solar and battery costs have been so much higher than fossil fuel costs that they played almost no part in setting the price of energy.
That has changed. In the most remote places, solar + batteries are now the cheapest form of energy. COVID supply chain issues aside, the costs of solar and batteries continue to fall.
This puts an upper bound on energy prices.
Net effect: Energy costs will be limited for the next few years. And then will likely become a tailwind for company profits and demand.
Investment Overview
So, the last 40-50 years has seen five key tailwinds: female participation in the workforce, favourable demographics, increasing debt, increasing trade and reducing taxes. These have more than offset the effect of increasing inequality.
Going forward the female participation tailwind looks to have finished. The baby-boomer tailwind is about to (or has already) become a headwind. Trade is no longer a tailwind, it may become a headwind. Increasing debt is still happening, but levels are elevated, and there is probably not much room left on this front. Corporate taxes are still a tailwind. Inequality is still growing – I’m not going to call the end of tax reductions/inequality until we start to see more public backlash. Energy will become a tailwine.
So, we are at an inflexion point. I believe the long-term trends are turning from negative to neutral. But they are going to be overwhelmed in the next few years by some major medium-term trends which we looked at last month.
Investment Outlook
I have some pretty clear ideas about which trends are sustainable and which ones aren't in the long term. However, the short-term is far less clear:
- The banking crisis is morphing into a credit crunch. This is the number one US issue over the next few months.
- The sanctions on Russia are unlikely to be lifted anytime soon. The short-term effect was commodity shortages. In the longer term, it seems likely that we will see a re-orientation, Russia will supply more to countries like China and India, less to Europe. For some commodities (oil, wheat) this will be easier. For others (gas) it will be extremely difficult.
- The geopolitical energy crisis in Europe has eased on the back of much warmer weather. Australian energy price caps have pushed down energy prices. There will be a rush to alternative energy sources in the mid-term.
- Supply chains continue to improve.
- Governments continue to withdraw (or not replace) stimulus. There will be a fiscal shock into 2024. The question is whether the private economy will be strong enough to withstand it. Leading indicators suggest profits will be lower.
- Central banks have made it clear that they will try to solve the Russian-induced energy issues and supply chain-induced inflation by raising interest rates. The odds of a policy error have increased significantly.
- China still has not bailed out the property sector. Changes so far are not a bailout... but they may morph into one. China is trying to ensure that houses under construction get built, small businesses have access to credit, infrastructure building continues, and failing developers do not crash the economy. China is yet to show any signs of turning back to the old days of debt-driven property developer excesses. If China doesn't continue to roll out new measures, the commodity market will deflate again.
It is still not the time for intransigence. Events are still moving quickly. But we have positioned the portfolio towards the most likely outcome and are gradually increasing the weights as more data arrives.
Bond yields have risen significantly. If the world heads for a recession this is a buying opportunity. In the short term the narrative "high inflation, central banks raising rates = sell bonds" seems to be coming to an end. Although there may be another last hurrah as the US central bank looks to rein in the stock market optimism.
The mix of higher volatility, leading to deleveraging of risk parity trades and momentum means yields could yet go higher. We are invested for bond yields to reverse.
Asset allocation
After being very expensive for a number of years, stock markets briefly touched off average value before becoming expensive again. However, debt levels are extremely high. Earnings have been going backwards, and seem overly optimistic in 2024.
Markets are supported to a great degree by central banks and governments. Policy error is every investor's number one risk.
But, any number of other factors could force this off course and see unexpected inflation. Energy prices could jump higher, increasing inflation. Chinese/developed world tensions might rise further, leading to more tariffs. Or, China might decide again to supercharge property investment.
We are significantly underweight Australian shares, and as noted above, overweight bonds, with the view that the Australian market is more quickly affected by rising interest rates and more affected by a global recession:

Performance Detail

Core International Performance
The dovish tone set by the US Fed saw a continuation of the Santa rally into December, however currency eroded much of the gains for local investors as the AUD continued to rise strongly into the new year. We took profits on DBS (Singaporean bank) as we see better prospects in European banks in this interest rate environment.

Core Australia Performance
Australian equities saw a strong Santa rally driven by across the board gains. The weaker oil price saw the Energy stocks as the worst performers.
Portfolio Yields

This table shows the income yields of our various portfolios, including their proportion of Franking and Foreign tax paid over the past 12 months.
We also include an estimate of forecast yield (next 12 months), assuming no change in current tactical allocations and stock composition. There is an element of rising yields, as global interest rates rise. Offsetting that however, is the possibility Australian equity yields may fall as commodity-driven mining companies have lower profits to pay out. Our underweight Resource position in Core Australia portfolio should help maintain its yield.


