After crashing lower in June, stock markets staged a comeback in July. The ASX rose 5% and International stock markets rose 6.4%. While our Australian portfolio outperformed on the back of a lower exposure to resources, our international lagged the world market due to a lower exposure to tech stocks. The bond market continued to reflect our point of view, 10 year bond prices rose (yields fell) in July. Our growth fund finished up 3.7%, accumulation 3.9% and income up 2.3%.
Maybe that will be the end of the equity bear market. Valuations have returned to a more normal range, high inflation implies a strong economy and company earnings estimates remain strong. Many are making that argument. I think they are wrong.
After huge government transfers over the last 2 years, companies and consumers are being asked to stand on their own. Can they? Skyrocketing energy and housing prices are a drain on budgets, not a sign of an economic boom. There is a risk of a significant reversal in inflation, and I wouldn't rule out deflation in 2023/24 if central banks follow through on their current path.
Our concern is that central banks are suggesting that they will solve inflation problems, which are largely a result of supply chain issues, by restricting demand. This is not an attractive setup for markets.
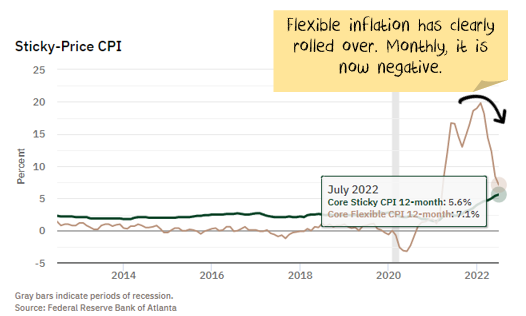
The US just printed 8.5% inflation. And markets celebrated. The reason is that the underlying numbers are starting to show what we have been saying for a while: the inflation is not entrenched, and will come to an end. Those deeper in the weeds will note that a number of aspects of inflation have clearly rolled over, and are even starting to print deflation:
With that in mind, we thought it worth re-visiting the four main points from our inflation piece last year. This post forecast the coming of the inflation wave which came to pass, now the focus is on whether the leaving also occurs.
1.Why today’s inflation is different from the 1970s
What we said rings largely true today. The major change was first the restriction of gas by Russia in late 2021, followed by the attack on the Ukraine. Both of these sent energy prices much higher:
The world has changed. The structure of today’s economy is radically different to the 1970s and 1980s.
1. Base effects. Most of the inflation is either in the supply chain or comes from low base effects, both of which will pass.
Stimulus cheques do create inflation by boosting demand. But a one-period inflation spike does not create ongoing inflation.
2. Economic orthodoxy has been over-engineered to prevent inflation. Stagflation was rampant in the 1970s and 1980s. The end came when central banks (led by the US) showed they were prepared to cause recessions to “anchor” inflation expectations. Just as importantly, new rules were enacted to “ensure” inflation wouldn’t return:
Monetary system: Independence from political intervention for central banks, inflation targets, various rules on government money printing.
Deregulation: A range of industries changed from public to private ownership, lowering costs.
The pendulum has swung too far. The steps taken to prevent inflation have entrenched disinflation.
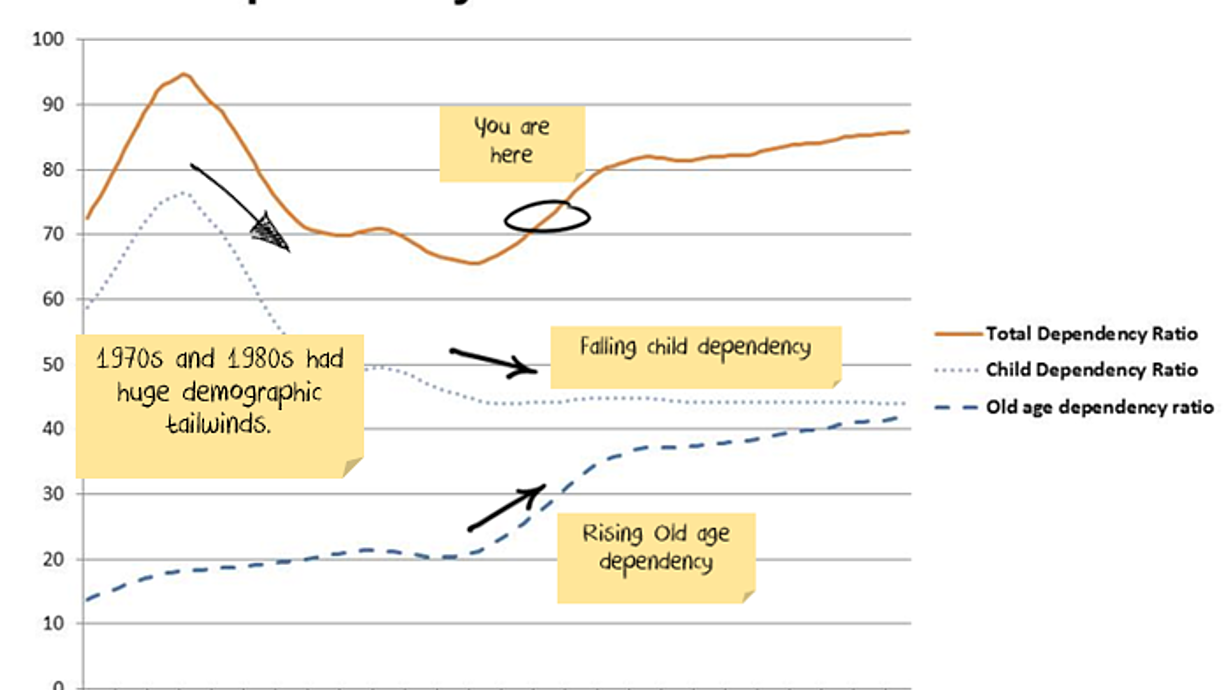
3. Changing economic structures: In most developed countries, manufacturing has shrunk as a proportion of the economy by a third since the 1980s. Union membership has plummeted. This puts even more focus on wages, as wages are the largest cost for service companies. Secondly, the 1970s and 1980s saw significant financial reforms which dramatically increased debt levels. While debt is increasing, inflation increases. But high levels of debt are deflationary. Finally, demographics are no longer a tail-wind:
4. Technological innovation: In recent decades, the internet disintermediated entire industries, reducing costs, increasing competition and lowering inflation. Energy and automation will be the drivers for the 2020s.
2. China’s impact on commodity prices
This part we nailed. Construction is very weak in China and showing few positive signs. Without a major policy change in China, the best you could hope for would be an "L" shaped property recession, where property simply bumps along the bottom. The risk is that the return is much worse.
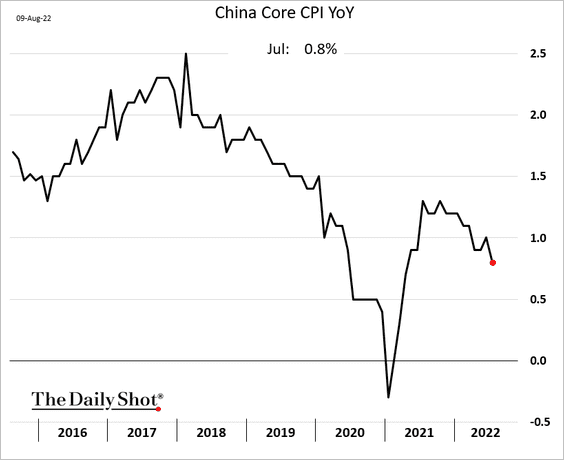
Chinese consumer inflation (CPI) continues to be weak
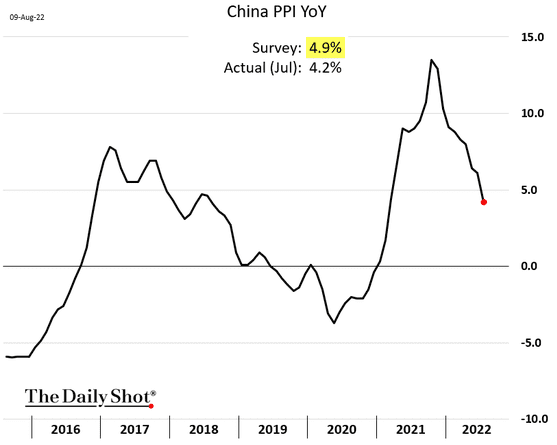
Producer price inflation is reducing sharply from its highs:
Weak prices seem to be embedded. Suggesting that it may not be long before China's biggest export (once again) is deflation.
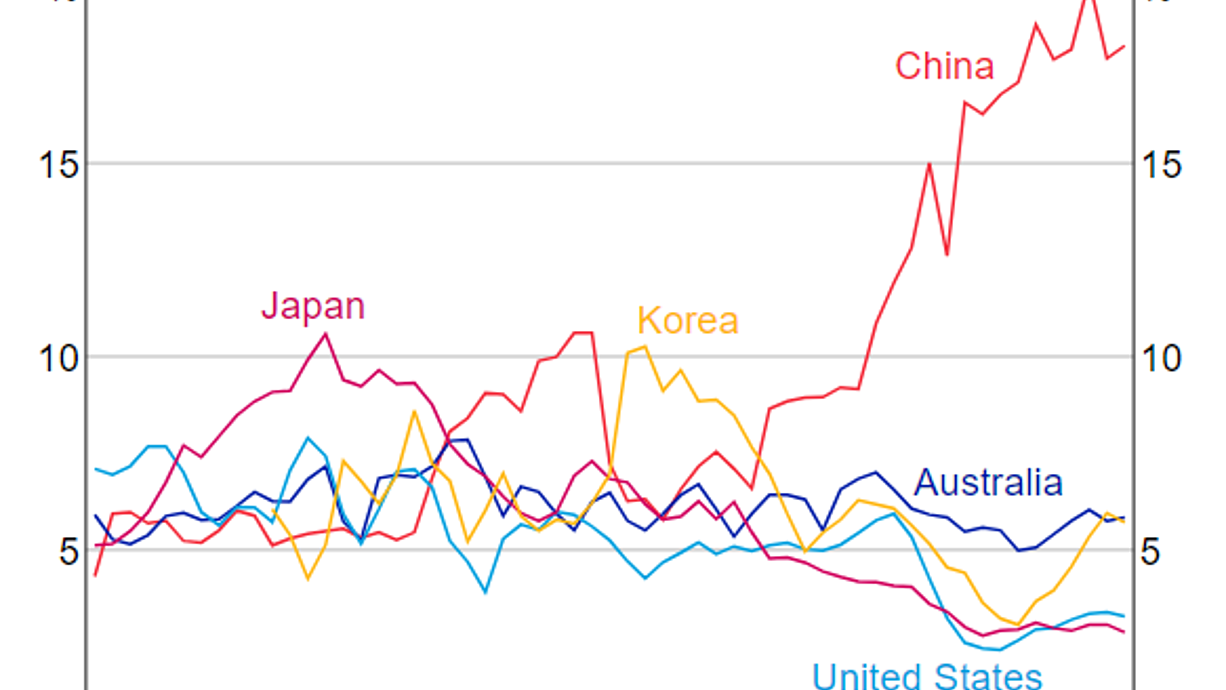
China uses an incredible amount of commodities relative to its size. This is not a long-term phenomenon. It has arisen in the last 20 years:
The real culprit is the Chinese property construction sector. Far more than other infrastructure – even railways are not that steel-intensive. The big consumer of steel is high-rise buildings.
Residential investment in China, as a proportion of GDP, is double the level of Japan before its housing crash and three times higher than the US before its housing crash.
Over the long term, we expect this to converge to more normal levels, particularly due to demographic headwinds.
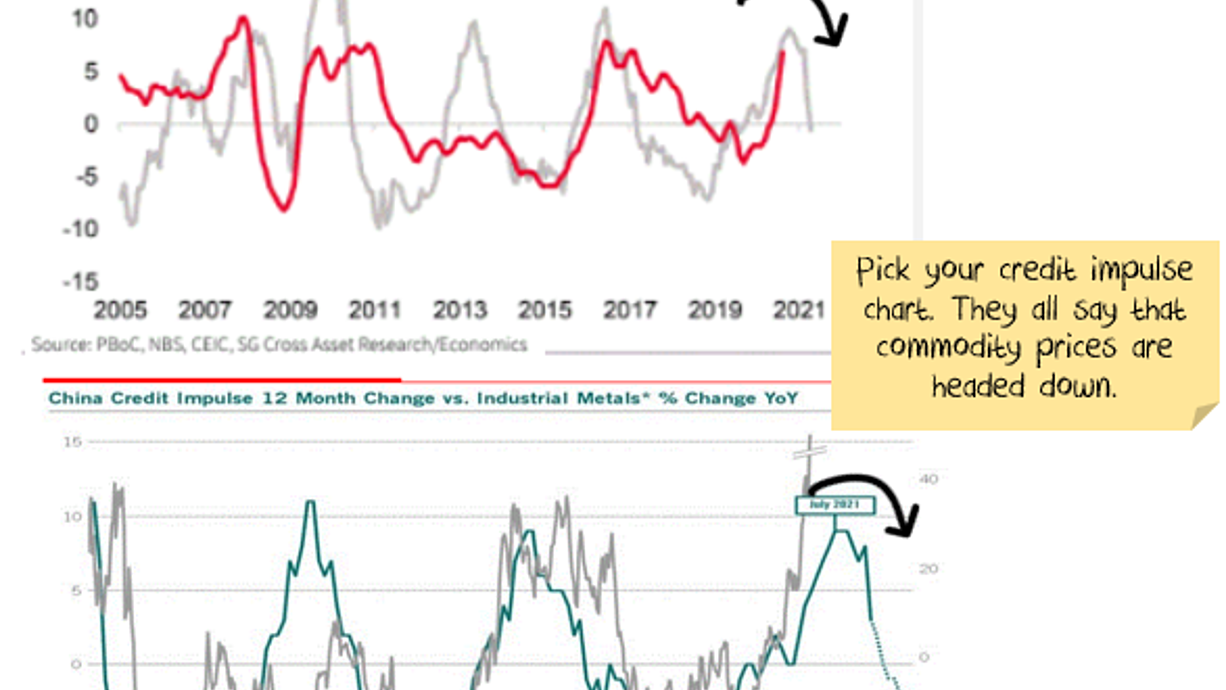
Again, on its own, this suggests a longer-term downside for commodity demand. But admittedly, the overspend could last for years. The reason we are concerned is that credit growth has come to a halt:
Several investment banks are pitching the story that you need commodity exposure to protect you from rising inflation. A weak Chinese construction market will blow that story out of the water.
There are both long-term and short-term reasons for the construction cycle to be peaking in China. Commodities are standing in the blast zone.
3. The inventory supercycle
Our expectations of an inventory supercycle appear to have been well founded. Athough I must note that while we have seen the upswing due to inventory issues, there are still only very nascent signs that the downswing has begun:
The basis of most business cycles has an inventory cycle at the core. The stocking and de-stocking cycles are what typically drive economies both into recession and out of recession.
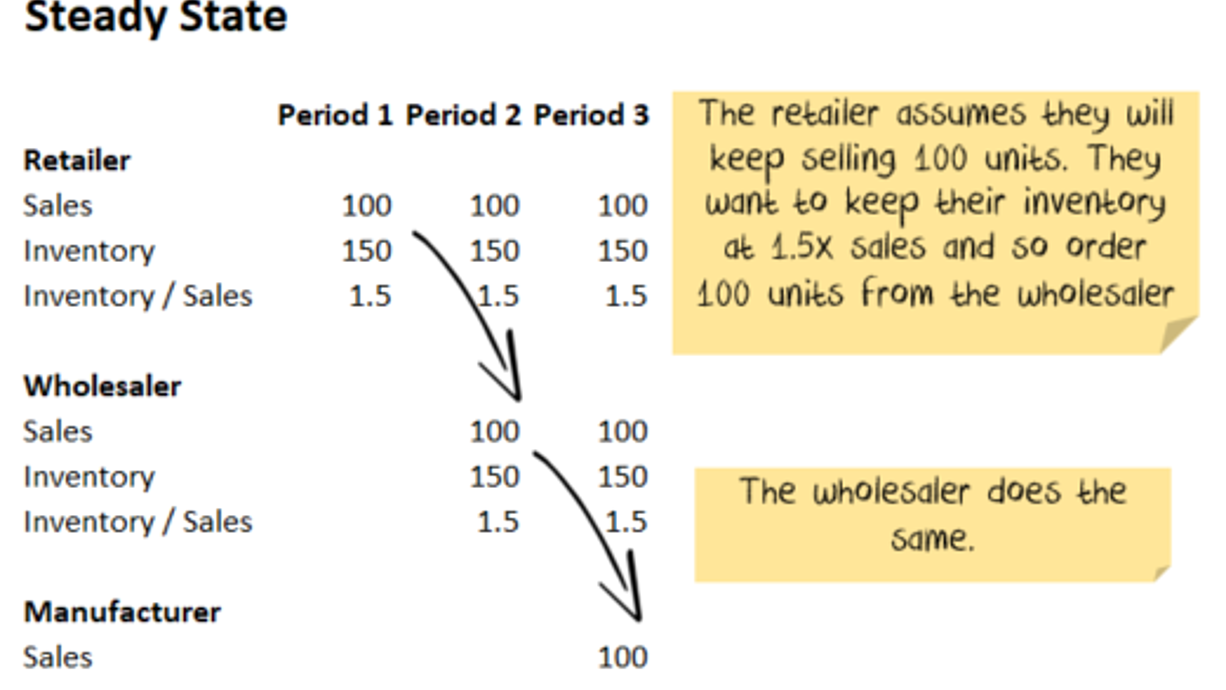
Assume we have:
A retailer who buys from a wholesaler
A wholesaler who buys from a manufacturer.
We are looking at the changes from period to period. For some companies, the periods are days. For others, the periods are weeks, months, or quarters. Both the retailer and the wholesaler target 1.5x the current period’s sales as inventory.
It looks like this:
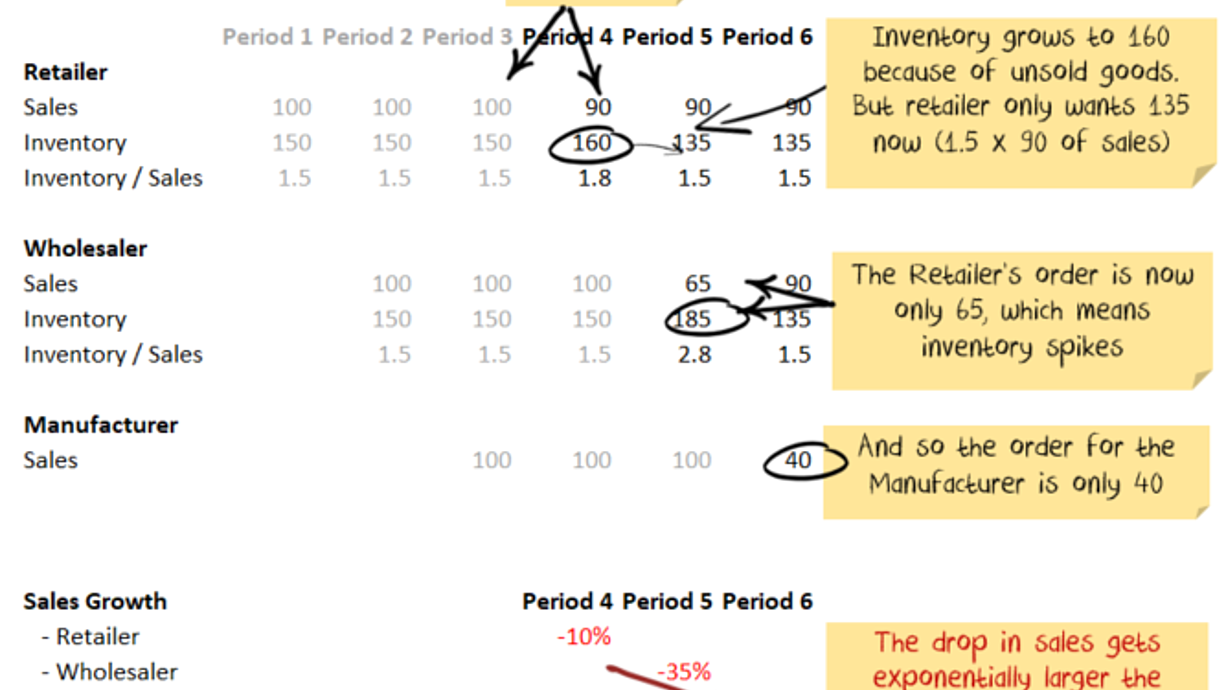
Now let us look at the effect of a drop in demand. Say sales drop 10% for the retailer and then stay at the new level:
As you can see, the effect is more significant the further down the supply chain you go. A 10% fall in sales for the retailer is a 60% fall for the manufacturer. In the initial stages of a recession, this effect worsens the cycle as manufacturers then fire staff/pull back spending. However, it works in the other direction as well. When the cycle turns, the opposite effect kicks in.
An extraordinary convergence = an inventory super cycle.
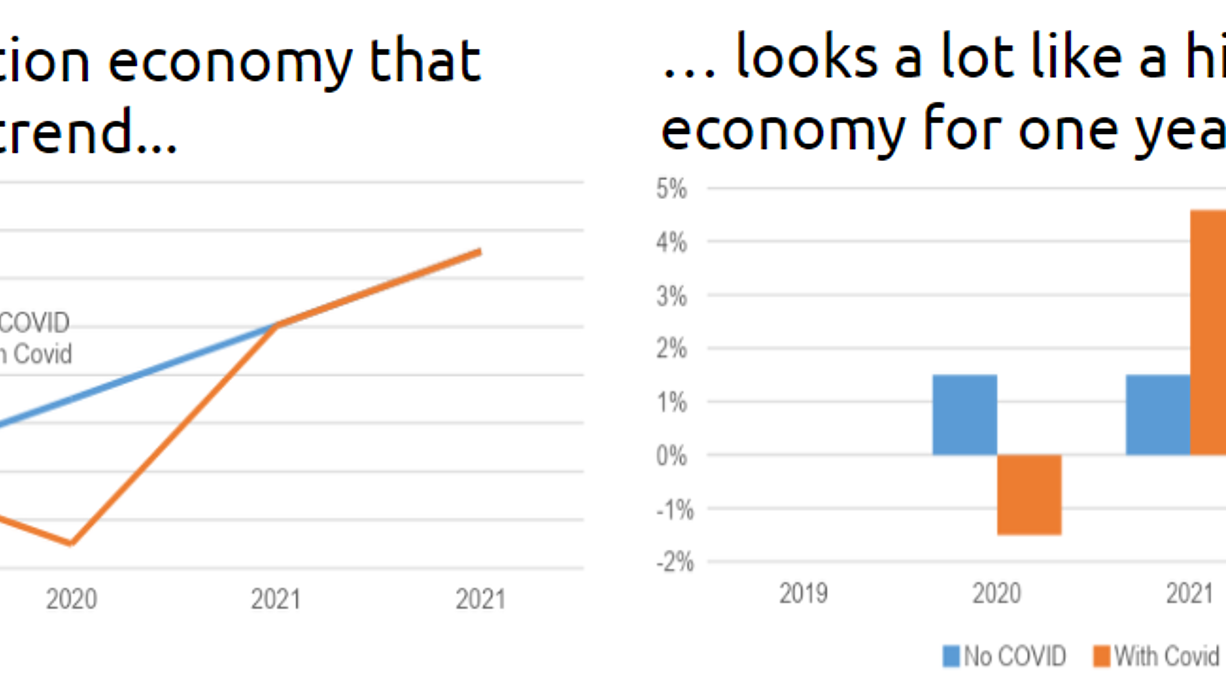
Demand for goods has been temporarily boosted by:
Lack of other options as services like travel and recreation were shut.
Government stimulus, both direct and indirect.
Pent up demand as consumers who built up savings and are now spending.
A need for greater inventories from businesses to mitigate against future supply shocks.
Meanwhile, supply has been temporarily constrained by:
Lockdown constraints on workers.
Changes in demand. For example, more demand for houses, less for apartments. Manufacturers/suppliers need to change processes.
The Suez Canal blockage.
If we are in a supercycle where demand increases and then returns to trend, it will be a wild ride for manufacturers. But inventory cycles are short. The price signals of today are building the excess capacity of tomorrow. The signs are good for economic growth but are not indicative of rampant inflation.
Latest data is showing signs of turning down
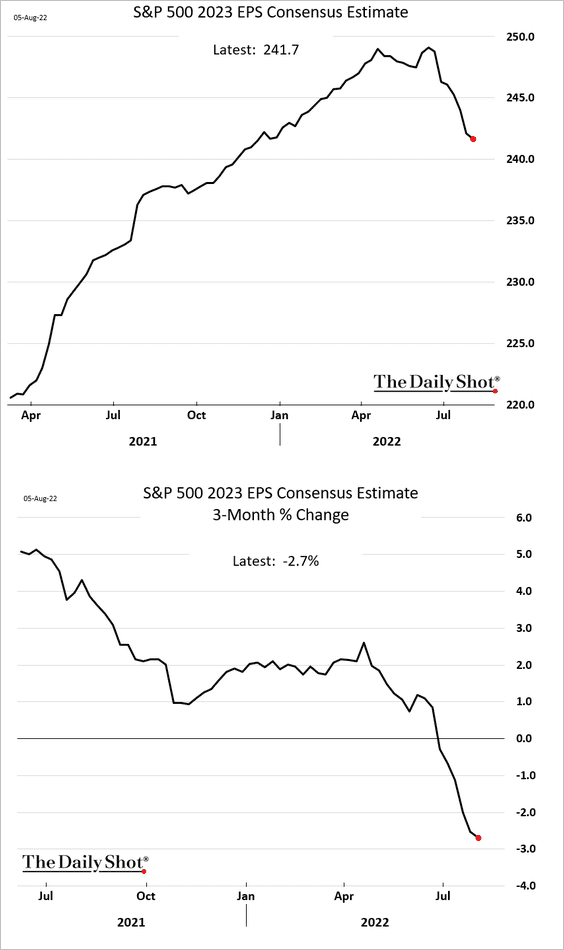
The next step in our outlook is for both earnings and inflation to fall, which we are expecting over the next six months.
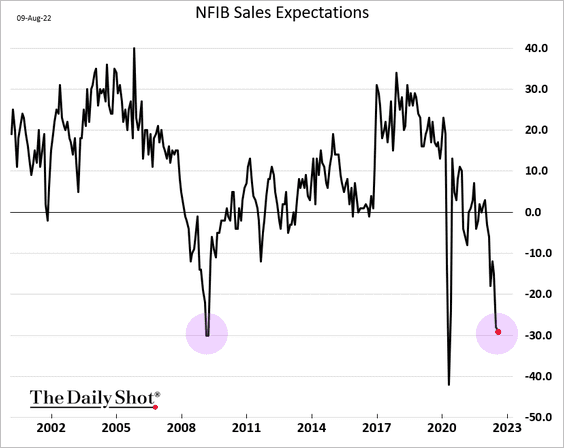
Early indicators (i.e. surveys and forecasts rather than hard data) have turned down, some quite decisively.
The next few months will be key to proving or disproving this outlook.
In our view central banks are in an unenviable position, raising rates to try to bring down inflation that is largely supply side driven and so the danger is that they do too much to try and influence a measure that they have little control over. Interest rate rises work well on demand side inflation, much less well on supply side inflation.
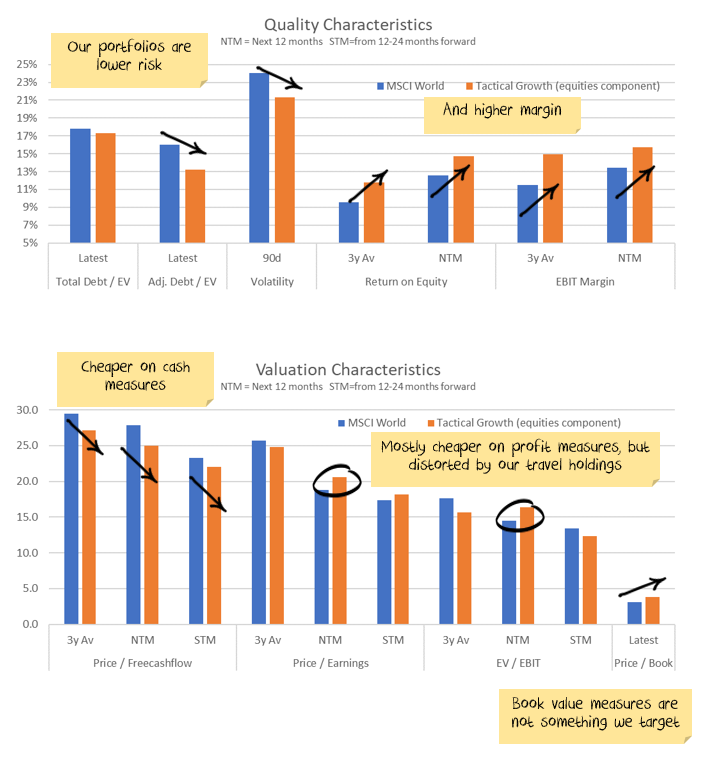
Valuation
Stock valuations came back to the upper end of reasonable levels, last month. But, with markets bouncing and earnings falling, valuations are starting to look more expensive again. Valuation does matter. But earnings growth matters more. In a good year, earnings can easily grow 20% or more, making an expensive market fair value. The danger is that earnings can also fall quite precipitously. And today, in my assessment, that is where the danger is.
At an aggregate level, earnings growth still looks OK. But most of the growth in the last reporting season came from energy and resources. And, effectively, central banks have promised to kill commodity prices to bring down inflation.
Earnings forecasts are still for another 20% combined growth over 2022 and 2023. In the face of a recession, that is heroic. Even if there is not an economic recession, I'm expecting a sharp slow down in profits.
Earnings are more likely to be flat over two years, with risks to the downside. On that basis, stocks would still be at the more expensive end of historical ranges. Heading into a potential recession, that is not where you want valuations to be.
Have we seen this all before?
Globalised supply chains reversing into more local production due to geopolitical tensions
A pandemic disrupting supply chains
A surge in inflation due to supply issues
Central banks hiking rates into a supply-side shock
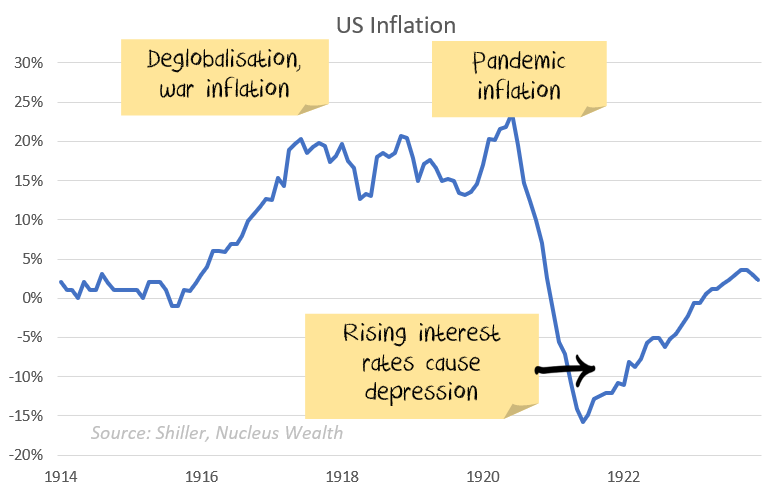
Yes, we have. Following World War I, all of the above factors were in place.
By 1920, inflation in the US was running at 15%. The US central bank hiked rates from 3.5% to 5.6% to curb demand. By 1921 the US was in a depression, with inflation of -10%.
The analogy is not exactly the same. But, trying to use interest rates to solve supply chain problems is at the core. There are more similarities than there are differences.
Investment Outlook
I have some pretty clear ideas about which trends are sustainable and which ones aren't in the long term. However, the short term is far less clear:
The sanctions on Russia are unlikely to be lifted anytime soon. The short term effect is probably commodity shortages. In the longer term, it seems likely that we will see a re-orientation, Russia will supply more to countries like China and India, less to Europe. For some commodities (oil, wheat) this will be easier. For others (gas) it will be extremely difficult.
The Omicron variant looks to be resolving in the direction we expected, ripping through economies without too much harm and leaving behind an acceptance that COVID is endemic. In China, however, rolling lockdowns will likely continue for the rest of the year.
The geopolitical energy crisis in Europe has turned acute and infected Australia. This will subtract from European and Australian growth in the short term, there will be a rush to alternative energy sources in the long term.
Supply chains continue to improve.
Demand is challenging to read and distorted by Omicron. Demand held up far better than prior virus waves.
Governments continue to withdraw (or not replace) stimulus. There will be a fiscal shock in 2022. The question is whether the private economy will be strong enough to withstand it. Leading indicators suggest profits will be lower.
Central banks have made it clear that they will try to solve the Russian induced energy issues and supply chain induced inflation by raising interest rates. The odds of a policy error have increased significantly.
China still has not bailed out the property sector. China is trying to ensure that houses under construction get built, small businesses have access to credit, infrastructure building continues, and failing developers do not crash the economy. But China is yet to show any signs of turning back to the old days of debt-driven property developer excesses. Unless they change, this will deflate the commodity market.
It is still not the time for intransigence. Events are still moving quickly. But we have positioned the portfolio towards the most likely outcome and are gradually increasing the weights as more data arrives.
Bond yields have risen significantly. If the world heads for recession this is a buying opportunity. The problem in the short term is that the narrative "high inflation, central banks raising rates = sell bonds" is surging still.
And the mix of higher volatility, leading to deleveraging of risk parity trades, and momentum means yields could yet go higher. We are starting to invest for bond yields to reverse.
Asset allocation
After being very expensive for a number of years, stock markets flirted with fair value last month. Since then, with rising prices and falling earnings, valuations are now slightly expensive. Debt levels are extremely high. Government/central bank support continues but is slowing. Earnings growth had been really strong but has come to a halt. There are signs it is starting to reverse.
Markets are supported to a great degree by central banks and governments. Policy error is every investor's number one risk.
But, any number of other factors could force this off course and see unexpected inflation. Mutations could disrupt supply chains again. Chinese/developed world tensions might rise further, leading to more tariffs. Or, China might reverse its tightening on property sectors. Biden may get through additional stimulus, driving increases to minimum wages.
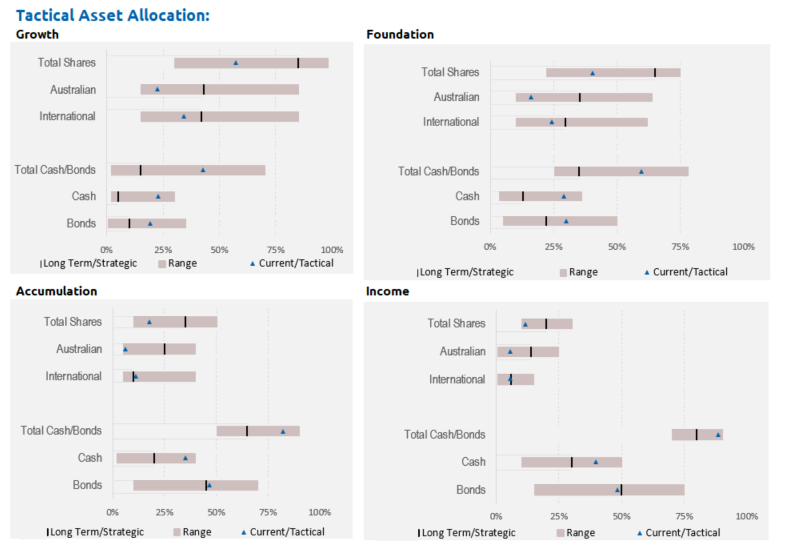
We are significantly underweight Australian shares, with the view that the Australian market will be the one most affected by a slowdown in China and a global recession:
Performance Detail
Core International Performance
Following the June low, July was an up month as all Markets bounced. Our portfolio closely tracked the index most of the month only missing some of the end-of-month Tech rally. The AUD strengthened with the commodity bounce, accounting for around 1% of performance. After our rebalance in June we made no changes to our stocks.
Core Australia Performance
Domestically July was also a strong up month. Once again our portfolio performed considerably better than the index but this month it reflected our underweight Materials exposure as commodity-dependent stocks had a more subdued rally relative to other sectors. No changes were made to the portfolio this month.
Damien has a wealth of experience across international equities (Schroders), asset allocation (Wilson HTM) and he helped create one of Australia’s largest independent research firm, Aegis Equities. He lectured for over a decade at the Securities Institute, Finsia and Kaplan and spent many of those years as the external Chair for the subject of Industrial Equity Analysis. Damien runs the investment side of Nucleus Wealth, selecting stocks suggested by analysts and implementing the asset allocation. Damien started Nucleus Wealth after 20+ years in financial markets. He wanted to come up with an investment solution for ordinary investors that delivers the same types of personalised investment portfolios high net worth investors use.

-2.png)