


17.2 Please describe how the investment team responsible for this asset class is structured. Please include a reference to back- up procedures and ultimate investment responsibility.
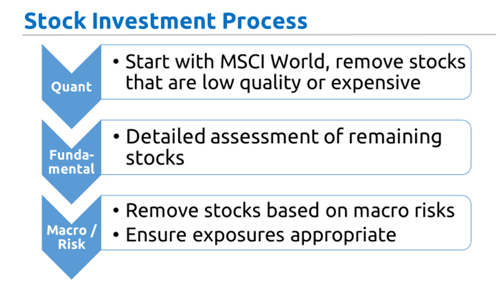
The investment team is split into four functions:
· Quantitative Screening and Analysis. The first stage of both the stock selection process and the asset allocation process is the generation of suggestions from quantitative models. This is performed primarily by Damien Klassen. Radek Zeleny is the key quantitative backup if Damien is unavailable.
· Fundamental Analysis. Analysts examine each stock and sector generated by the quantitative screens and provide advice to the investment committee.
· Stock Selection Investment committee. This meets regularly (usually fortnightly but more frequently when required), with the purpose being to create a list of “acceptable stocks” that can be invested in and broad sector investment parameters for the portfolio manager. The details of the members are included in Appendix 1.
· Risk Management/portfolio construction. The portfolio manager Damien Klassen manages the portfolio construction based on stocks from the stock selection investment committee. Note that the stocks from that committee are a broad list and he has some flexibility to choose stocks. These changes can be based on a number of factors like:
o valuation, i.e. if a stock rises significantly then it might no longer be a candidate to buy
o market events. E.g. takeover offers or profit warnings
o in order to achieve a portfolio or risk outcome. For example the stock selection committee may treat Boeing and Airbus as acceptable with a preference for Boeing. He may choose to invest in Airbus instead to increase the portfolio exposure to Europe or to Euro costs.
Radek Zeleny is the key stock selection backup if Damien is unavailable.
17.3 Describe the investment philosophy that underlies this particular product including references to any market inefficiencies you aim to exploit. What evidence do you have to support this approach to investing? Please be concise and do not use any marketing embellishment.
Our Investment philosophy is that high quality assets at reasonable prices provide the best investment outcomes for investors.
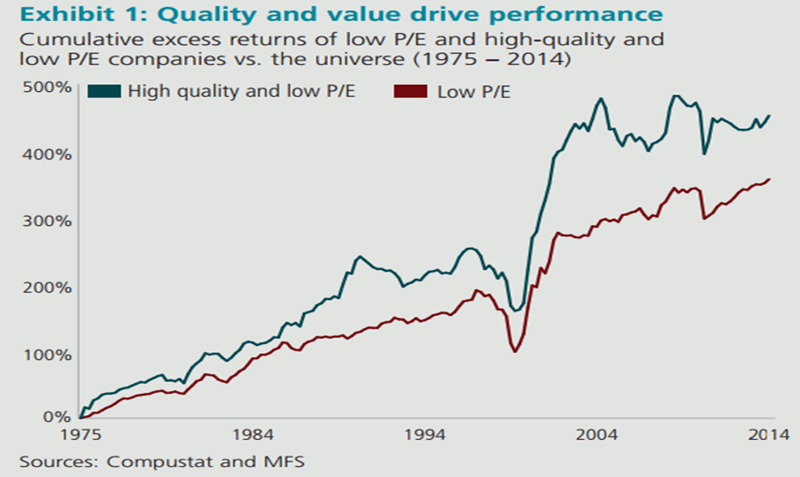
Not only do studies show that these assets provide higher returns over time, but the path is also much smoother as the lowest quality and most expensive assets will often rise the most during bull markets and then fall the most during bear markets.
While we use quantitative methods extensively, we also note that quantitative methods often suggest investments in value-traps, and that analyst oversight adds value to the investment outcome by screening these stocks from the process. i.e the philosophy of choosing high quality assets at reasonable prices can largely be performed quantitatively, but analyst input can ensure that the quality and value characteristics are real and not statistical anomalies.
17.4 State briefly the competitive advantage that underlies this strategy.
Both Quality and Value screens have been shown to generate excess returns over the long term. The combination of the two strategies tends to result in a lower risk portfolio with considerable downside protection.
We have a considerably more practical view of quantitative metrics relative to other quantitative funds. Accounting standards have changed considerably over the past 20 years, and many strategies have not adjusted for the changes. We particularly note the changes to the calculation of shareholders equity as distorting a number of key metrics.
We have considerably more focus on return on re-invested capital than most other quantitative funds. This is a difficult calculation, not easily standardised. However, the focus on this important measure we believe uncovers important insights into companies.
One of the key issues with purely quantitative screens is the propensity for “value traps” to appear in screens. We use fundamental analysts to analyse each stock in the portfolio in depth to minimise the risk of investing in value traps.
17.5 Please complete the following information for your flagship product in this strategy:
17.6 Briefly describe your investment style (passive/growth/garp/value etc.). Is the nature of your investment approach fundamental or quantitative? Is your approach top-down, bottom-up or a combination of both? Please be concise and do not use any marketing embellishment.
The investment style is a mix of quality and value.
Quantitative methods are used to select the stocks in the portfolio, fundamental analysis is employed to ensure that the stocks are not value traps or are of low quality.
Stock selection is bottom up, and then top down analytics is applied to the resulting portfolios to ensure that net portfolio weights are appropriate.
17.7 Has your investment style changed in the last five years? If it has, describe all changes and the reasons for these changes. (Note this question relates to style. It should not include reference to changes/enhancements to the investment process per se.)
N/A
17.8 Explain your investment process (use a diagram if appropriate).
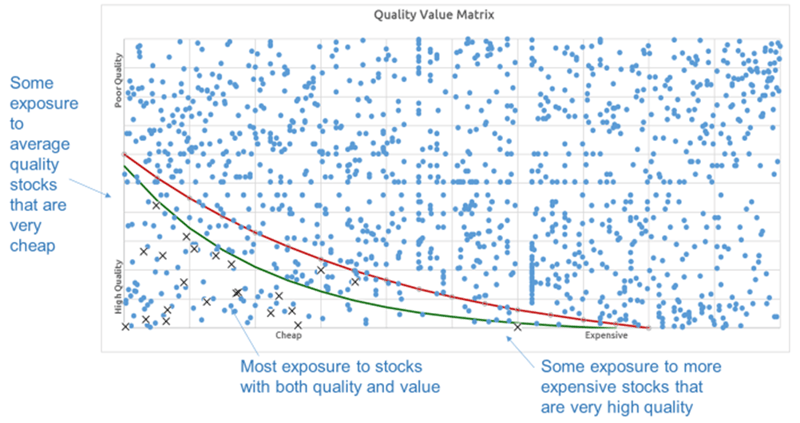
Step 1: Quant Screen
We use quality and value screens as our first cut. The idea is that we only buy stocks in the bottom left-hand quadrant of this graph:

For the Quality score, we use a broad range of factors including:
- Economic Moat: High margins, high returns, high proportion of earnings converted to cashflow
- Economic Trajectory: High marginal returns, above average EPS growth, sustainability of economic moat
- Stability: Earnings, cashflow, dividends, share price
- Financial: Appropriate gearing, interest cover
For the Value score, we use a broad range of factors including:
- Cashflow: Free cashflow, Operating Cashflow
- Earnings: Range of earnings measures, pre and post abnormals, EV/EBIT, P/E
- Balance Sheet: Asset backing, replacement value
- Returns: Dividends, sustainable dividends, buy backs, capital returns
All factors are measured over varying time frames:
- Long term value and quality: Inflation adjusted earnings / cashflow over 5-10 years – identifying cyclical industries and companies
- Current value and quality: What are the latest accounts telling us
- Potential value and quality: How much hinges on forecast earnings
Factors are also compared across different universes. For example when looking at EBITDA margins, it is inappropriate to compare a service company (with very low levels of depreciation) with a capital intensive manufacturer. Some of the most common universe splits we look at are:
- Global value and quality: comparing every company
- Industry value and quality: comparing with companies in the same sector – are there features of the Industry that are inappropriate to compare
- Country value and quality: comparing with companies in the same country – are there country factors at play
- Business Model value and quality: Service companies have much lower depreciation rates than manufacturers – are there business model factors that are affecting results
Step2: Fundamental Analysis
After we have screened stocks, we then hand them over to fundamental analysts to put stocks into five categories:
- Best Ideas: Stocks that the analyst recommend owning in our portfolio. Stocks that have both quality and value characteristics, and in the best cases an element of growth. These stocks we are more tolerant of when they move just outside our investment bands.
- Deep Value/Turnaround:Stocks that the analyst thinks have potential but no catalyst. These are stocks that are very cheap, likely beaten down in price, might be cyclical (close to the bottom of the cycle) and have limited downside. The analyst may not be able to see a catalyst for the price increasing over the next year, but in our larger portfolios they are happy for us to own the stock with the view that there is limited downside. We would expect these stocks to provide stability if the market sells off. These stocks we are less tolerant of when they move just outside our investment bands, and we look to limit the number of these stocks in our portfolio.
- At the right price: Stocks that the analyst would recommend owning in our portfolio if the price were lower. Stocks that have quality characteristics, and in the best cases an element of growth, but are currently too expensive. These stocks are the ones that we may own in our international portfolio if they fit a diversification or risk purpose. We are likely to own these stocks in our Australian portfolio as the universe of investment opportunities is lower.
- In Reserve: Stocks that aren’t in the above categories, but are coming up in or just outside our screens. These stocks are the ones that the analyst is maintaining a lower level of coverage. They are stocks that we are likely to own in the future subject to catalysts, improved earnings or lower share prices.
- Value Traps: Stocks that consistently appear in our quant screens but the analyst recommends avoiding. These stocks that show up on quant screens but are fundamentally flawed. For example it may be a resource stock with a short mine life or an industrial whose profits are elevated due to a government grant which is about to end.
Analysts complete a company model, a valuation, a company profile and investment thesis for each stock in our portfolio. For many stocks this also involves speaking to management and competitors.
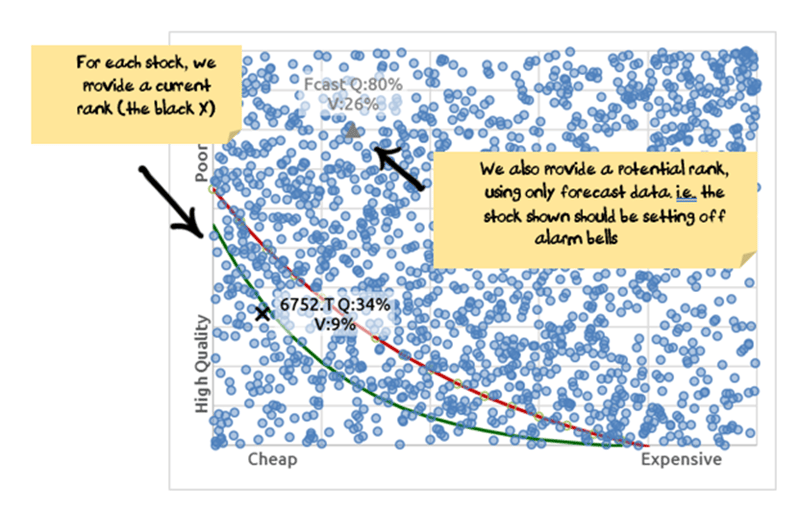
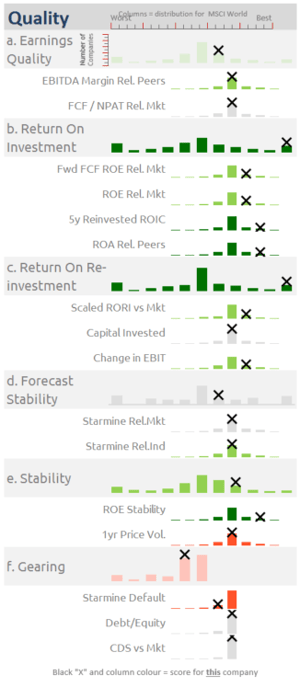
To aid with the analysis, a detailed quantitative report is produced which highlights key reasons for our quantitative model liking the stock and any potential concerns. For example, the company below is rated highly on both return on investment and return on re-investment, however there are some debt concerns:
The stock selection committee then reviews each stock and confirms its rating.
Step 3: Thematic Portfolio Construction
The portfolio manager decides which stocks to enter into each portfolio.
When putting together portfolios, the portfolio manager is looking for a mix of sectors, a mix of countries, a mix of business types (i.e. services, manufacturing, intermediaries), a mix of risk and a mix of quality and value (i.e. some high quality/moderately expensive, some moderate quality/cheap, some both). We also look at thematic themes and other risks. For example, an analyst might have Boeing in their “best ideas” and Airbus in their “at the right price” category but find that we buy Airbus because we need more European exposure.
Step 4: Trading considerations
We have a trading score as well as a quality and value one. It is based on a number of factors, share price momentum rates highly. It also includes factors like short selling, option pricing, analyst recommendations and other short term factors.
We use this score to influence the timing and highlight stocks that may have issues.
Analysts can expect more questions for stocks with poor trading scores and greater scrutiny than ones with a good trading score. For stocks already in the portfolio with poor trading scores the analyst may be asked to go and perform further analysis.
For example for a stock in our portfolio where we see short selling increase, put options getting expensive and poor share price momentum we go back to the analyst to get more information to see if there are any major issues that we may be missing.
Step 5: Portfolio Optimisation
Based on the size of the company, the risk parameters, the valuation and the expected price characteristics (volatility, correlation, beta, liquidity etc) we may increase/decrease the weights of stocks within the portfolio.
17.9 Describe any enhancements that have been made to your process over the last year.
We have been focussed on return on reinvestment over different timeframes and the effect of using P&L vs cashflow on investment returns.
The major change to processes in the past year has been a temporary de-weighting of current and one year forward measures in our investment assessment process due to the impact of coronavirus shutdowns.
We are now looking in more detail at two-year forward numbers, although we on cognisant that analyst forecasts have a poor track history this far forward. We also look in detail at five year average numbers, adjusted for purchasing power parity.
17.10 Define the authorised universe of investable securities for your flagship fund and the sub-universe of securities that are actively researched. What is your investment approach to securities that are not in the Index?
We are able to invest in stocks in the MSCI AC World Index.
We actively research World stocks that meet our quality and value metrics. Broadly this involves being in the top 25% of stocks on either metric.
For stocks that have dropped out of the index, that we already own, we are able to hold the stock for up to 13 months.
17.11 Describe briefly your stock selection process including your “research effort” (e.g. reliance on internal versus external research, company visits, type of analysis carried out and key criteria targeted in the research process). Please confirm whether the metrics used in the research process (or their relative importance) vary between regions/ countries/ sectors etc.
See section 17.8 (above) for stock selection process.
The research is a mix of internal and external research.
Companies in our quantitative screen use data from Thomson Reuters, S&P CapitalIQ, consensus forecasts and our own models. There is ongoing effort to improve the quant process based on external quantitative research, internal quantitative research and based on feedback from analysts where companies that are not quality or value appear in our screens.
Fundamental analysts have a range of requirements depending upon the classification of the stock. For the highest rated stocks, analysts need:
· a financial models and a valuation
· Assessment of a range of other valuation metrics (P/Book, P/E, EV/EBITDA etc)
· A written investment thesis, including a response to any quantitative factors where the company rates poorly
· To take part in investor conference calls
· Meet management where required
Key factors analysts consider in modelling include:
· Appropriate levels of capex for the business over long term
· Return on re-invested capital
· Where mid-cycle earnings is and how low cycles are in its industry
The analyst also performs a detailed business model assessment:
- Sector / Industry
We use a mix of GICs and our own custom sectors to create a comparable industry.
- Business Model
- Commodity Extraction
- Commodity Refining (take one commodity, turn it into another)
- Manufacturing (take a range of commodities and turn them into a physical product)
- Intermediary (take a product from one person and sell to another without significantly altering the product)
- Services
- Landlord (included Financial Landlords, Physical Landlords, Intellectual Property Landlords)
- Content / IP producer
- Customer Type
- Consumers
- Businesses
- Intermediaries / resellers
- Government
- Sales Type
- Transactional
- Short term contract (<3 years)
- Long Term contracts
- Customer Purchase frequency
- Regular (daily / weekly / monthly)
- Semi-regular (1-4 times a year)
- Irregular
- Target market (relative to industry)
- commodity products (little to no difference between final product)
- high volume, low margin (compete mainly on price)
- premium brand (compete on quality or perception of quality)
- exclusive (restrict volume to increase price eg Ferrari, LMVH)
- Currency Exposure
- Almost None: Creates and sells in same country, mainly domestic competitors (currency not an issue)
- Import Competition: Creates and sells in same country, competes with both domestic competitors and importers (currency somewhat an issue)
- Mismatch: Costs mainly in one currency, revenues in a different currency (Export to other countries)
- International Profits: Produce and sell in multiple countries, main currency issue is translating profits back to head office currency
17.12 What are your sources of value add? Please use the table below to illustrate where out-performance is expected to come from?
| Source of Value Add |
% |
|
Quant Screening |
50% |
|
Analyst modelling/reviews |
20% |
|
Sector Allocation |
30% |
|
Total |
100% |
17.13 At what levels (e.g. sector specialist, asset allocation committee, or regional managers and analysts) are decisions made regarding portfolio exposures (e.g. regional/ country allocation, sector/ industry allocation, stock selection within overseas markets and currency management?
The principle is that:
· the quantitative model effectively creates the initial weights
· the stock selection/asset allocation committees influence those weights from a top down perspective. Sector specialists have some input at this level. Currency positions are considered at this level
· the portfolio manager creates the final weights based on a mix of the above plus risk and portfolio construction metrics.
17.14 Describe your portfolio construction process covering: tools/techniques, buy/sell disciplines, number of stocks held, stock weightings relative to index, determination of large/medium/small cap exposure, country bias, sectorial bias, securities that are not in the index and the cash allocation decision. To what degree does the portfolio manager have discretion?
The cash balance is kept to a minimum in this portfolio, targeted between 2% and 5%. This portfolio forms part of the tactical asset allocation portfolios and so no asset allocation decisions are made at the international portfolio level.
The maximum stock weighting is 4%, and the portfolio targets 60-80 stocks.
Stocks entering the portfolio are considered at maximum weight, and then scaled lower or higher for the following factors:
· Quality score
· Value score
· Trading score
· Analyst view
· Sector view
· Asset allocation view
· Portfolio characteristics (i.e. is there a positive or negative risk benefit from adding the stock to the portfolio
All stocks in the investable universe are large or mid cap. We do not specifically target company size in the portfolio construction
Buy / sell decisions are based on the company’s quality or value rank as shown on the diagram below:
Stock weights can be higher than shown on the chart in a few circumstances:
· The expected “future quality” or “future value” score is attractive enough to warrant inclusion in the portfolio. This is more likely to be a stock that is already owned rather than a new stock in the portfolio, in order to minimise turnover.
· For portfolio construction or diversification benefits.
For stocks that drop out of the index, the fund has thirteen months to sell the stock.
17.15 Explain how regional/ country allocations are adjusted (e.g. via physical securities, ETF’s or derivatives).
Positions are adjusted using physical securities. ETFs are used for small balance clients where the cost of holding direct equities may be too high.
17.16 What impact does currency have on your stock and country selection decisions?
For every stock in our portfolio, the analyst classifies the stock based on its exposure to changes in currency. These vary from stocks that have costs and revenues in one currency and have only domestic competitors to companies that have an active mis-match between costs and revenues.
Using this information we establish two levels of currency interaction:
· The effect of the stock value to an Australian investor based on currency changes
· The effect on company earnings based on currency changes
When creating the portfolio, we look at the exposure to both of the above effects based on the stocks suggested by the quantitative model.
If there are strong macro-economic risks to the positions that the quantitative model suggests, the portfolio manager will scale back the positions or look for offsetting exposures to minimise the risk to the portfolio.
In limited circumstances the manager may choose to hedge some of the currency exposure using ETFs.
17.17 Describe the process employed in managing currency and the way currency is integrated into the total portfolio. Describe any situation where cross-currency hedging would take place.
See 17.16 above
17.18 Does the strategy allow shorting? How are short ideas sourced and managed in the portfolio? (if relevant, contrast this process with the management of long ideas.) Are there any particular analyst incentive practises in place with regards to shorting?
No
17.19 Describe your approach and strategies employed when shorting securities (e.g. alpha shorts, pair’s trades, funding trades). What is the typical % of the portfolio in short positions? Describe the distinctive risk management approach used for short positions.
N/A
17.20 Do you have a policy of selling down securities once they reach a particular market cap? If so, describe this policy.
If stocks drop out of the MSCI AC World Index then the fund has 13 months to sell the stock
17.21 How are trades allocated across portfolios? What processes are in place to ensure portfolios are structured consistently and excess cash is not held?
Nucleus has outsourced the management of the Seperately Managed Accounts to Praemium whose role is to allocate trades and ensure portfolios are structured consistently and excess cash is not held.
Additionally, Nucleus has internal systems to monitor portfolio construction and check that clients hold the correct weights.
Due to the nature of Separately Managed Accounts, there will invariably be portfolio differences between clients. We also note that unlike in a unit trust, excess cash from one investor does not represent a “drag” for all clients as the cash for each client is managed independently.
17.22 Describe what steps you take to monitor and minimise transaction costs. What is the typical rate of annual turnover for the portfolio?
Trading is conducted by Praemium on a net daily basis. This allows trades for Nucleus Wealth’s portfolios to be netted off against opposing trades from all of Praemium’s other portfolios. So while brokerage is set at 5.5 bps for domestic trades and 15 bps for international, the realised rates are closer to 3 bps and 12 bps respectively.
All transactions are performed by Praemium for a fixed fee and the Nucleus board will re-examine the fees annually with a view to reducing the fee as funds under management increase.
Portfolio turnover is targeted to be around 33%, however in times of volatility it may be higher.
17.23 In what way is the after tax return for each stock considered prior each transaction? Are systems in place to monitor individual tax lots in portfolios? Are portfolios managed to after tax benchmark(s)? Is performance measured and reported on an after tax basis? Are portfolio managers incentivised in relation to pre and /or post-tax performance?
Our portfolio manager considers trades on an after tax basis, examined from the view of a typical Australian investor who can take advantage of franking credits and benefit from reduced capital gains on stocks held longer than a year.
Praemium has tax accounting functionality and considers individual tax lots within portfolios.
Given the broad array of investors and tax positions, Nucleus manage to a pre-tax benchmark.
17.24 Summarise your risk management techniques in table format (e.g. regional/country limits, stock/sector limits, currency limits (active, hedging limits) ex-ante tracking error/active share, quality filters, market capitalisation limits, cash limits, constraints on derivatives, stop loss limits when shorting etc.) .Please define these limits as hard or soft in nature.
|
Risk |
Limit |
|
Max stock position on purchase |
4% |
|
Max stock position |
6% |
|
Max holding of a company’s issued capital |
5% |
|
Maximum country overweight * |
15% |
|
Maximum sector overweight/underweight* |
+/-15% |
Max allocation to cash |
5% |
* Relative to MSCI World Index
17.25 Please explain how you use derivatives. Who is responsible for managing and implementing derivative strategies?
N/A
17.26 To what extent do you participate in transactions such as underwriting issues, etc. originated by another division of your firm?
N/A
17.27 Describe the procedures used to ensure consistency of performance across portfolios with similar objectives.
Where Nucleus manage similar strategies, we look to hold the same stocks whenever possible. This helps reduce trade costs, tax issues for customers with multiple Nucleus products, analyst effort and helps the consistency of performance.
Nucleus has outsourced the management of the Separately Managed Accounts to Praemium, whose role it is to allocate trades and ensure portfolios are structured consistently.
Additionally, Nucleus has internal systems to monitor portfolio construction and check that clients hold the correct weights.
Due to the nature of Separately Managed Accounts, there will invariably be portfolio differences between clients.
17.28 Please describe the trading process (e.g. responsibilities of the portfolio manager versus dedicated traders, utilising programme trades, algorithms and Direct Market Access) and outline your broker selection and allocation process.
All transactions are performed by RE for a fee. RE allocates these trades to brokers on their panel.
We note that all securities are very large and very liquid relative to the amount that Nucleus will be investing.
17.29 What market condition(s) are typically conducive to the outperformance of this strategy? In what market or economic circumstances would this strategy typically under-perform?
Typically, a blend of Quality and Value strategies performs in line with rising markets and then outperforms in a falling market. In a rapidly rising market where valuation is less important (eg. Tech boom in 2000) the strategy would be likely to under-perform.
17.30 Provide an estimate of your capacity for the strategy. Do you regularly conduct formal capacity studies (include the date of the most recent study)?
Generally each stock is less than 2% of the portfolio and greater than $20b in market cap. Even if the fund were $50b in size, it is unlikely to own more than 5% of any individual stock.
We have not conducted any formal capacity study. We will conduct a formal capacity study if/when this strategy reaches $1b.
17.31 What factors do you consider when determining your capacity constraints in the management of this strategy? (e.g. metrics utilised, regularity of formal review, is the strategy’s capacity considered in isolation to other strategies managed by your organisation in this asset class or in the aggregate etc?) Please explain your soft and hard closing policy/discipline.
We have undertaken basic liquidity and ownership screens to determine that our capacity far exceeds our expected funds for the next two years.
17.32 Please describe how you integrate your consideration of ESG issues in your investment decision making: please include information on ESG research and its role in the investment process.
We take a two pronged approach to ESG:
· First, we incorporate a number of ESG factors into our quantitative screens for stocks – we invest in quality stocks and consider good corporate governance to be a quality factor.
· Second, we encourage investors to incorporate environmental and social exclusions into the portfolios that we provide. We offer a range of ethical exclusions such as uranium, tobacco, carbon and alcohol. Investors choose exclusions on a portfolio by portfolio basis.
17.33 Do responsible investment practices form any part of investment managers’ goals/incentives/remuneration? If yes, please provide brief details.
No. Responsible investment practices form part of our investment process but are not specifically part of our incentives for managers.
17.34 Do you have any additional resources outside the investment team with specific ESG related responsibilities or incentives? If yes, please provide brief details.
We use S&P CapitalIQ research to help identify and score issues.
S&P CapitalIQ provides structured and standardized research data.
The data is gathered from publicly available information sources and is manually collected to ensure that the information is standardized, comparable and reliable. All of the ESG data collected is quality controlled and verified by analysts and automated checks.
17.35 Do you identify and prioritise ESG issues and set engagement objectives for a particular company and, if so, how?
Yes. We have a number of qualitative screens based on ESG issues that go into our quality score. We do not invest in companies with poor quality scores.
While our analysts do speak to companies and may mention ESG issues, we do not specifically engage with companies about ESG.