
Quantitative and statistical models are extremely useful in investing. But they are guides, not gospel.
Forgetting there are real consumers behind the sales numbers and real companies beneath the profit numbers is the first step to an investment model that is going to fail when you need it most. There is a reason you never see a bad investment backtest - because if a quant analyst gets a bad result they simply run the backtest again and again until they get a good one.
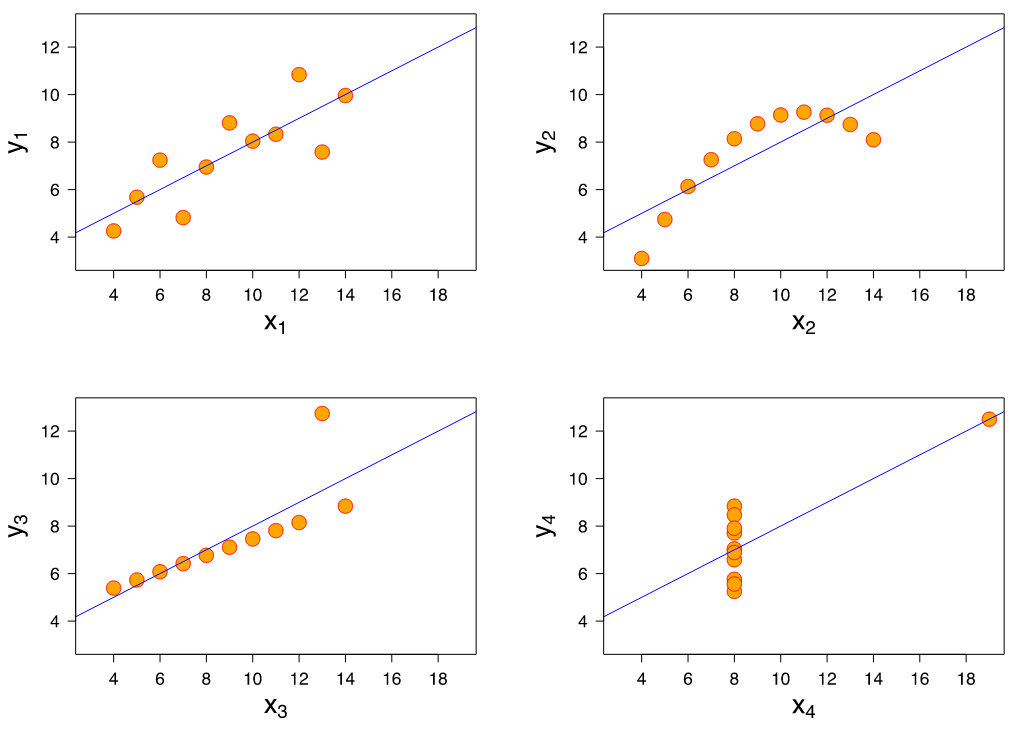
Anscombe's quartet
For years I have kept a chart of Anscombe's quartet as a reminder of how stats can mislead. Anscombe's quartet is a data series where all the summary statistics are close to identical:
- The average x value is 9 for each dataset
- The average y value is 7.50 for each dataset
- The variance for x is 11 and the variance for y is 4.12 for each dataset
- The correlation between x and y is 0.816 for each dataset
- A linear regression (line of best fit) for each dataset follows the equation y = 0.5x + 3
However, graph the data and the differences become obvious:
XKCD's Curve Fitting Methods
Along the same lines, XKCD has a light-hearted look at curve fitting models that many an investment analyst would be wise to keep near their desk. With many data sets, trends are in the eye of the beholder:


