
Deep in the Australian psyche is a conviction house prices only ever go up. It doesn't help that a large swathe of newspapers and television rely heavily on property advertising and thus have no interest in giving a balanced view.
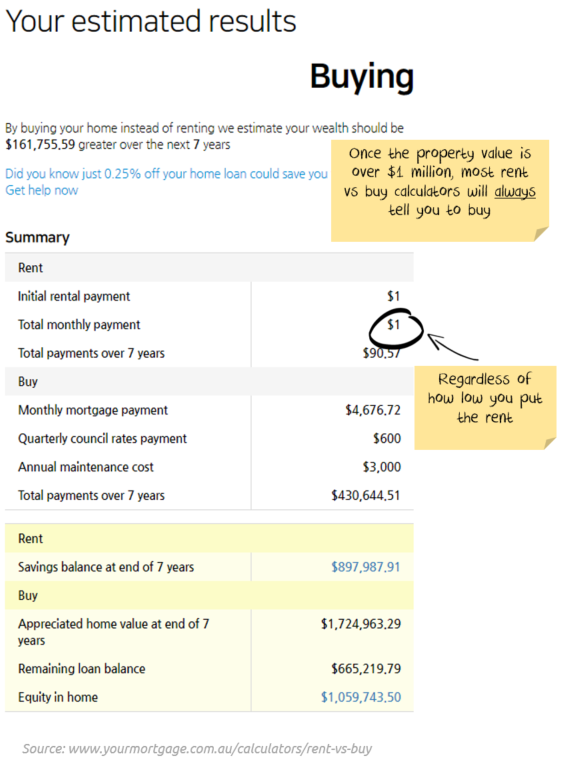
And don't get me started on calculators from mortgage sites. A friend challenged me on property after seeing one of the leading websites - Your Mortgage. He was looking at an inner-Melbourne rent vs buy calculation comparing a $1.0m house vs the $400 per week rent.
I guessed it would be line-ball (at best) as to whether to rent or buy. The site overwhelmingly recommended buying.
So, I tried halving the rent. Still said buy. Halve it again, still says buy.
What about $1 per month in rent or $1.0m to buy. Surely renting is better?
Your Mortgage says buy:
I thought Nucleus Wealth could do better. And so we put together a calculator to show where we think they are going wrong.
Where do most calculators go wrong?
Online sites for rent vs buying or buying vs shares generally plug in a property appreciation number based on past returns.
Your Mortgage is not the only offender. There are many other calculators where, with the default assumptions and a high enough property price, you cannot get them to tell you to rent. Ever.
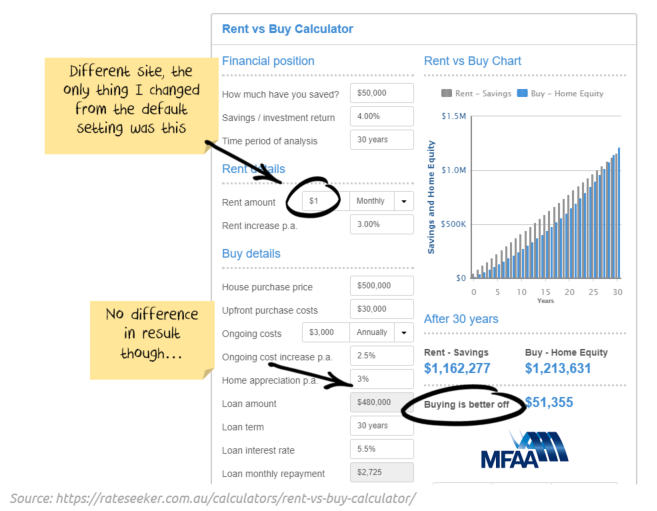
All of these sites have a common denominator - besides being financially incentivised to get you to buy property. They plug in a property growth forecast (often 7-10% p.a.) without any consideration as to how reasonable that forecast is and what it would mean.
Now, if you can borrow money at 4-5% and make 7-10% per annum, then it is not surprising that a calculator shows you producing a lot of money.
These assumptions though bear little resemblance to reality.
If house prices actually grew at 10% p.a. for the next 20 years, and inflation/wages/rents kept going up at their historical rates then:
- The median Sydney house price would be over $7m
- The median Sydney house price would be about 45x higher than the median wage.
- Even if you managed to scrape together the 5% deposit (only twice the median annual pretax salary) to qualify for one of #scottyfrommarketing's 95% mortgages, the mortgage payment would come in at almost 3x the median salary
If that is a realistic vision of the future to you, then you can stop reading. Property is the asset for you.
If you are interested in a more believable vision of the property market, read on.
How should you forecast residential property?
Keep in mind that I'm talking about forecasting residential property in aggregate - not individual houses or suburbs.
There are significant links between property prices and the availability of debt. The financial crisis showed this internationally. The Royal Commission into banking showed this in Australia. When the amount of debt available rises, so do property values. When debt slows down, property values fall.
The Federal Government seems hellbent on forcing more debt onto borrowers. So, I'm going to assume that credit is available for the moment. Even if I have some concerns in the event of a global shock. Like, for example, a pandemic that shuts down Australia's largest trading partner.
I'm going to argue four other factors also constrain how high property prices can go:
Factor 1: Mortgage Payments to Rent
This is a comparison of the cost of a mortgage with a 20% deposit, compared to the cost of renting the same house. By using this ratio to constrain house prices, we assume when the ratio gets high that people will prefer to rent rather than buy.
The consequence will be either (1) property prices will fall until it becomes more attractive for people to buy or (2) the Reserve Bank will lower interest rates and so the cost of a mortgage will decrease.
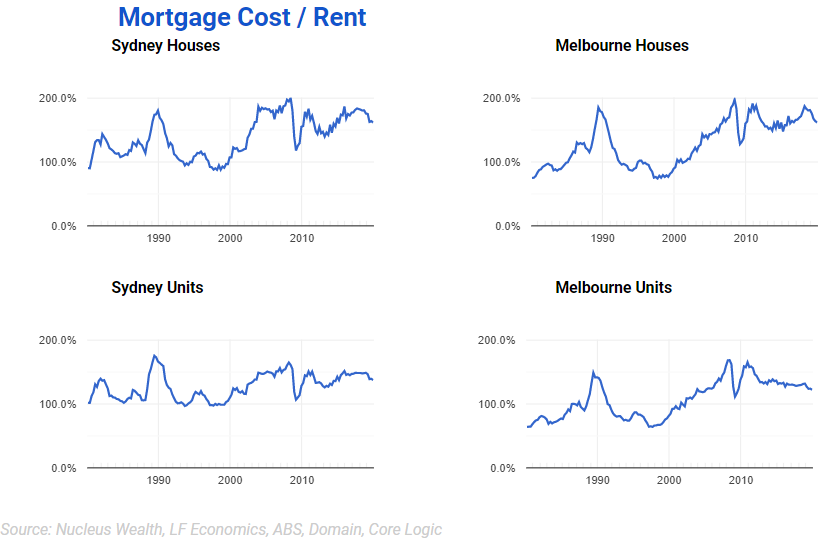
On the chart, the median for Melbourne Houses has varied between 75% and 200% on this ratio. In 1998 if you bought a median property, then your mortgage cost was 25% cheaper than the cost of renting the same property. By 2010, the cost of your mortgage was double the cost of renting.
The benefit of using this ratio is it provides insight into the decisions both homeowners and investors are making. When the cost of a mortgage is cheaper than renting for a homeowner, or an investor can see their mortgage paid for by the rent, then prices tend up. Also, rent is a relatively stable series:
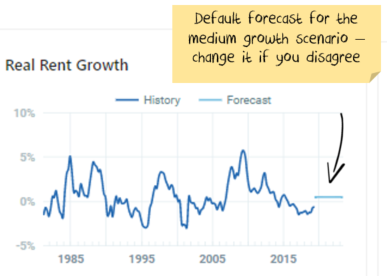
i.e. rents tend to go up a little more or a little less than inflation
The problem with using this series is that you can get significant changes in the series as central banks raise interest rates to slow the economy and then cut them to stimulate. It also ignores wage growth - strong wage growth supports higher prices. It ignores the higher deposits needed with higher house prices.
Factor 2: Mortgage Payments to Wages
By using this ratio to constrain prices, you are assuming when the ratio gets high, people rent because they cannot afford to buy. The consequence will be either (1) property prices will fall until it becomes affordable for people to purchase or (2) wages will rise until it becomes affordable for people to buy.
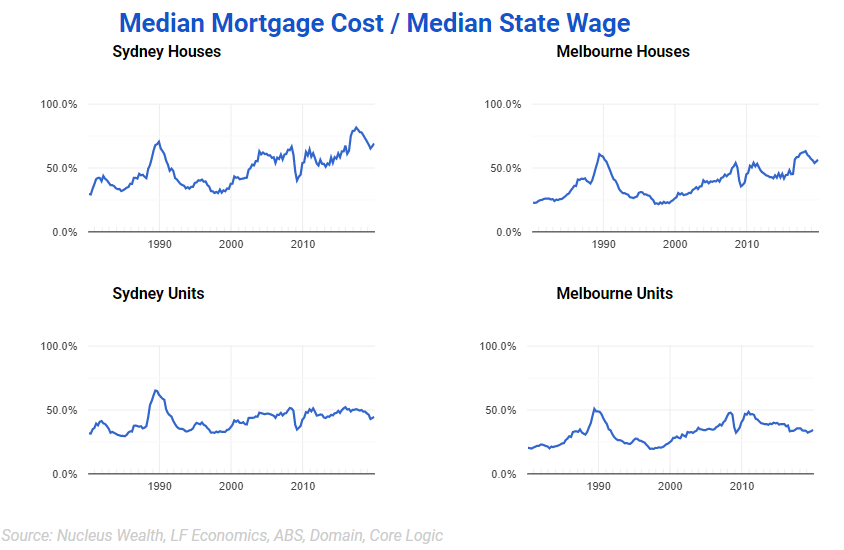
On the chart, the median for Melbourne Units has varied between 20% and 50% on this ratio. In 1998 if you bought a median property, then your mortgage cost was 20% of the median full-time wage of an employee in that state. By 2010, almost 50% of a salary would be needed, just to pay the mortgage.
The benefit of using this ratio is that it provides a realistic impression of the decision many homeowners make: they spend as much as they can afford. Also, wages are even more stable than rents:
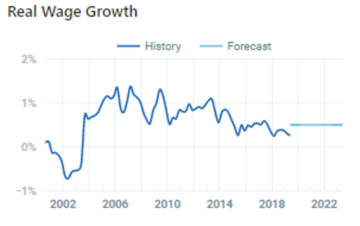
i.e. wages tend to go up a little more than inflation each year without much variation.
The problem with using this series is the same as the above: you can get significant changes in the series as central banks raise interest rates to slow the economy and then cut them to stimulate.
Factor 3: Property Price to Wages
By using this ratio to forecast prices, you are assuming when the ratio gets high people rent because they cannot save enough money to afford a deposit. The consequence will be either (1) property prices will fall until it becomes more affordable for people to buy or (2) wages will rise until it becomes affordable for people to buy.

The benefit of using this ratio is that it provides an additional dimension to the 2nd factor. Homeowners spend as much as they can afford, but they need to be able to save the deposit. This helps to indicate whether they can.
The problem with using this series is that it doesn't incorporate falling interest rates or changes in rent. For this reason, I tend not to use this as my primary forecasting method, more of an additional check on the outcomes.
Factor 4: Rental Yield
Rental yield is the annual rent divided by the property price. By using this ratio to forecast prices, you are assuming when the ratio gets low investors will not buy property as they are not getting a return that is high enough. The consequence will be either (1) house prices will fall until it becomes more attractive for investors to buy or (2) rents will rise until it becomes attractive for investors to buy.
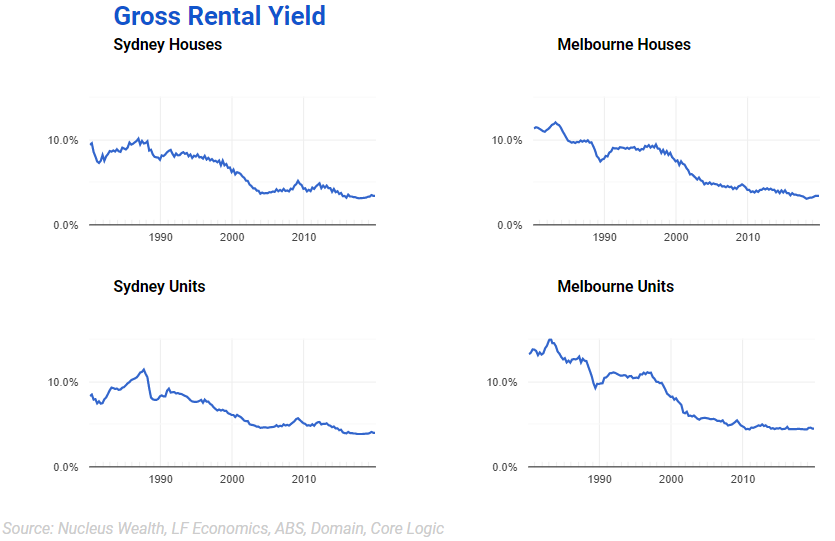
The benefit of using this ratio is that it provides a better indication of investor returns.
The problem with using this series is that it is hard to forecast. There is (probably?) a limit to how low yields can go, especially as there are only a few more rate cuts left. I would argue that the net (i.e. after subtracting costs) yield is a better indicator, but this is much harder to observe and requires guesswork. Another alternative would be the yield relative to something like a ten-year government bond. This would show the return for investors relative to other opportunities. However, if you wanted to forecast property prices that way, your first step would need to be to predict the 10-year bond rate, which is making forecasting harder rather than easier. For these reasons, I tend not to use this as my main forecasting method, more of a supplementary check on the outcomes.
Other Costs
Keep in mind with all property that what you own is a depreciating asset (the structure) on an appreciating asset (the land). Usually, depreciation in property price indexes is ignored.
Property indexes are different from other price indexes. A property index shows the change in the median house price. But that is not the same as the investment return.
The median house 50 years ago might have been a three-bedroom fibro house. The median house today might be a four-bedroom McMansion. Price returns from property indices suggest you bought the former and magically now you own the latter.
Every year there is a small change in composition - too small to see year by year but more evident over long periods. Add to that the spend on new kitchens, bathrooms, swimming pools and carpets that property price indexes ignore.
Actual investment returns do include those expenditures - our estimates suggest that investment returns are at least 1% lower than house price indexes suggest, probably 2-3% lower.
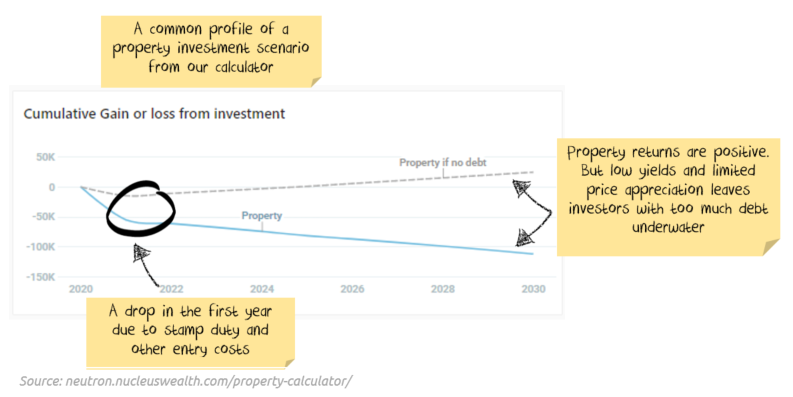
And that is before we have spoken about entry and exit costs. A $1m house in Melbourne has about $60,000 in entry costs and $30,000 in exit costs. That's almost 10% of the value of the home just to buy and sell.
Own your property forecast
The calculator here is designed to let you take control of the above factors to see the effects.
The best hope for a property bull is that people will be paying twice as much in mortgages as what it would cost to rent the same house, or that the median worker will be paying 80% of their pretax salary just to pay their mortgage in the future. Neither seems likely to me.
The second-best hope for a property bull is that inflation, wage growth and rent growth takes off. Under that scenario, rising interest rates will probably limit any benefit to the property market.
The main point I wanted to make with this calculator is that there are constraints on the housing market:
- Most of the rise in property prices has been because of falling interest rates. Interest rates have minimal scope to fall further.
- Inflation is stuck below 2%.
- Wage growth is anemic.
- Rents are going backwards in real terms.
If we fix issues 2-4, interest rates are going to rise, capping property price increases.
The secondary point I wanted to make is that borrowing lots of money on a property that is going only slightly up in price is a recipe for losing lots of money.
Hopefully, by testing assumptions with the calculator, you will generate insights of your own.


