
August proved to be a volatile month with the S&P 500 and Nasdaq-100 Indices posting their first monthly declines since February. Our more defensively positioned Tactical portfolios consequently outperformed their benchmarks as our large cash positioning meant we were able to avoid the negative returns this month.

Looking forward, we expect weak stock markets as the central banks raise rates to slow demand, shrinking company profits.
With that in mind, the key factor to watch in the coming months to tell if we are wrong or right is the change in corporate profitability. The recent reporting season in the US showed some signs of weakening earnings, but not enough to confirm our thesis yet. Earnings forecasts have been drifting lower.
Which forecasting school is crazy?
In macroeconomics, there is a firehose of data. Pick your bias, and you can usually find something to support it. Currently, the bulls can point to historical growth - the hard data. The bears point to surveys and expectations measurements - the soft data.
Stock markets rely on earnings. Paradoxically, they are showing the opposite! The bears can point to the hard data. Actual earnings have been bad. But, the bulls can point to the forecasts, where sunshine and roses are the order of the day.
Clearly, both cannot be right. Historically, stock markets have been the most prone to optimism. And even the hard macroeconomic data is starting to see some cracks. My expectation is that this will be the same once again.
Macroeconomics: Soft vs Hard Data
In financial jargon, data types range between soft and hard. Soft data consists of surveys and forecasts. Less reliable but usually much more timely. Hard data consists of confirmed results. Hard is much more reliable but arrives after the fact.
Usually, soft data leads hard data. For example, when it comes to employment:
- First, surveys say businesses are planning to slow hiring.
- A few surveys later, they show hiring slows.
- Then, announcements of layoffs.
- Finally, we see the unemployment rate rise.
Sometimes, it is different. The soft data signals a problem, but something intervenes, and the problem doesn't make it to the hard data. That may be the case this time. But there is such a broad and persuasive set of soft data showing problems that it is difficult to believe the soft data is wrong.
Can you come up with an alternative explanation?
Case in point, take the SEEK jobs data showing an extraordinary divergence between the number of applications and the number of ads:
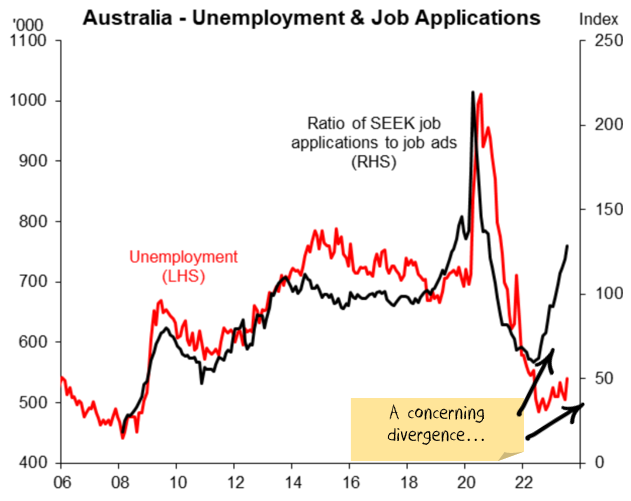
The obvious indication? It is a sign that workers find it difficult to get jobs. And rising unemployment is coming.
But I can paint a bullish picture as well. This time is different. The divergence may also be a sign that the record rates of immigration being run at the moment have resulted in a bottleneck of workers looking for jobs. Once they all settle in and start earning, there might be a subsequent boom in spending.
The problem with alternative explanations
On its own, the above story might be enough. The problem is that you are going to need a lot of alternative explanations.
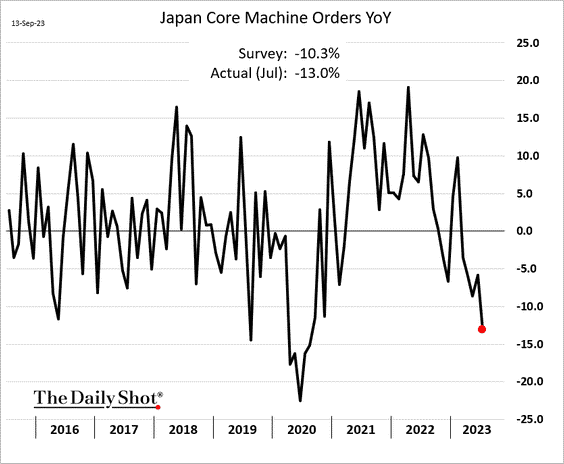
Japan is a big manufacturer; you need to explain why machine tools are in the toilet:
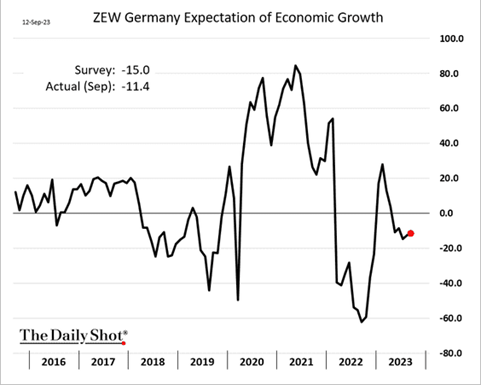
And why fellow manufacturer, Germany, have such pessimistic companies:
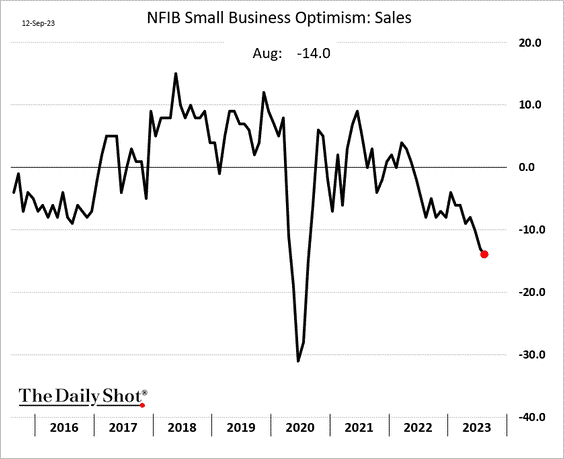
Or why small businesses in the US are so worried about future sales:
Throw in an explanation of why Chinese property starts are crashing. I could go on with rising bankruptcies, lack of credit growth, weakening capital expenditure plans and a dozen other forward-looking indicators.
At some point, maybe the simple explanation is the right one. Perhaps rather than a contorted alternative explanation for every indicator, the outlook is simply not that good.
Company earnings
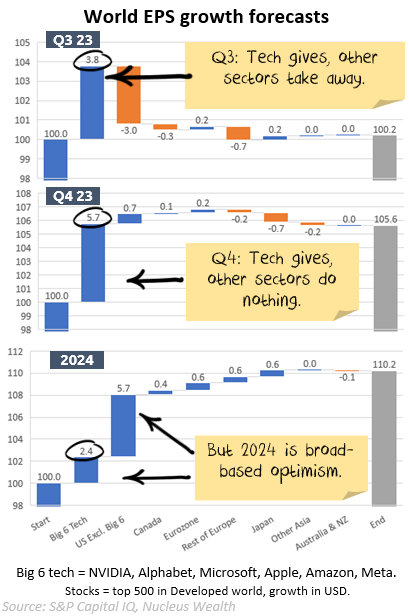
Here is where we turn things upside down. The actual data is bad, but the forecast data is excellent:
- Earnings have already been running at a negative clip. Q1 and Q2 earnings were both down around 5%.
- But, forecasts are for that to stop. Q3 earnings are currently expected to be around 0%.
- Q4, which starts in around two weeks' time, has earnings expected to be up close to 6%.
- 2024 earnings are expected to be up over 10%.
Is that all AI and tech? In Q3 and Q4, yes. All the growth comes from NVIDIA, Alphabet, Microsoft, Apple, Amazon, Meta. The other 494 stocks combined in our world sample are forecast to detract from growth.
In 2024, that is not the case. Only 2.4% comes from the big six, the other 7.8% comes from the rest of the market.
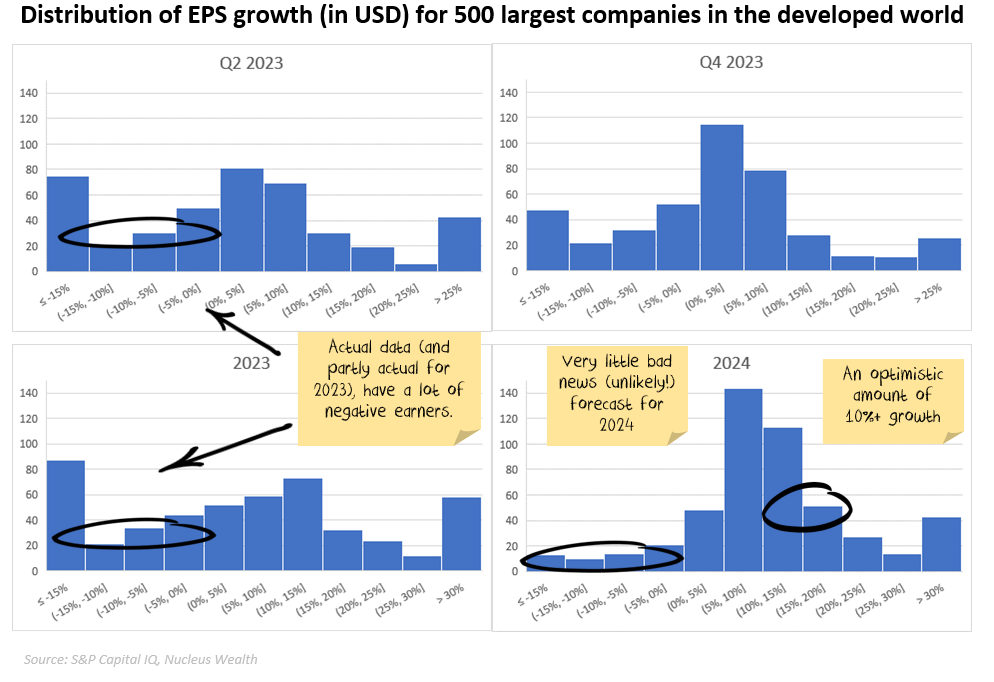
Half of the top 500 companies are expected to grow by more than 10%. Almost a third are expected to grow by 15% or better.
China's expectations also diverge from reality.
China is hugely important for Australia. Around 30% of the ASX is in mining and energy stocks, and there is a massive exposure to government revenue via high commodity prices.
China is very much another case study in expectations vs. results.
In November 2022, China issued a sweeping directive to rescue its property sector. Iron ore rallied hard, up 50%. The problem? There was a lot of noise, not a lot of concrete measures.
My take at the time was that the plan did not change the fundamental demand for new construction. For the most part, the elements were either (a) directives to various banks to lend more to developers, focussed on completing existing projects, or (b) reduced debt constraints or rules on individuals buying houses. Averting catastrophe rather than returning to the old normal.
But I closed my resources underweights anyway, until the euphoria dissipated!
So far, that has turned out to be true. There were more property announcements the next month after November. And the next. And the next. In fact, almost a year since the rhetoric changed, property starts are still falling:
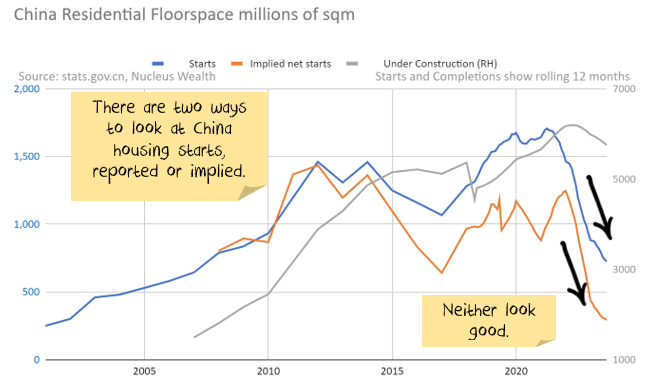
And the Chinese government's measures are still about completing existing projects. And solving the debt problem with more debt.
Markets seem to be pricing in an expectation that things are so bad in Chinese property that broad stimulus must be coming. I dug into that story last month. Even in the most recent month's improvements in China's economy, there was very little for the property optimist to hang on to.
This is China's fourth attempt in the past dozen years to wean itself off its property construction addiction. They lost their nerve on three prior occasions. Almost a year of (effectively) the same announcements repeated are thought to be a sign that China had once again lost its nerve. The events on the ground do not support that view.
When does reality bite?
At the moment, it seems markets are pricing for all of the following to occur:
- Forward macroeconomic indicators will be shown to be wrong
- Earnings growth will roar in 2024
- China's property market will return to growth
They might all happen. But each seems individually unlikely. And so the odds of all occurring will require some new deus ex machina. An unexpected, dramatically positive development. Could that be AI? We looked and concluded that it was not large enough in the short term.
I hope that something positive will emerge. But I won't position my investments like it is an inevitable outcome.
Investment Outlook
I have some pretty clear ideas about which trends are sustainable and which ones aren't in the long term. However, the short-term is far less clear:
- The banking crisis is morphing into a credit crunch. This is the number one US issue over the next few months.
- The sanctions on Russia are unlikely to be lifted anytime soon. The short-term effect was commodity shortages. In the longer term, it seems likely that we will see a re-orientation, Russia will supply more to countries like China and India, less to Europe. For some commodities (oil, wheat) this will be easier. For others (gas) it will be extremely difficult.
- The geopolitical energy crisis in Europe has eased on the back of much warmer weather. Australian energy price caps have pushed down energy prices. There will be a rush to alternative energy sources in the mid-term.
- Supply chains continue to improve.
- Governments continue to withdraw (or not replace) stimulus. There will be a fiscal shock into 2024. The question is whether the private economy will be strong enough to withstand it. Leading indicators suggest profits will be lower.
- Central banks have made it clear that they will try to solve the Russian-induced energy issues and supply chain-induced inflation by raising interest rates. The odds of a policy error have increased significantly.
- China still has not bailed out the property sector. Changes so far are not a bailout... but they may morph into one. China is trying to ensure that houses under construction get built, small businesses have access to credit, infrastructure building continues, and failing developers do not crash the economy. China is yet to show any signs of turning back to the old days of debt-driven property developer excesses. If China doesn't continue to roll out new measures, the commodity market will deflate again.
It is still not the time for intransigence. Events are still moving quickly. But we have positioned the portfolio towards the most likely outcome and are gradually increasing the weights as more data arrives.
Bond yields have risen significantly. If the world heads for a recession this is a buying opportunity. In the short term the narrative "high inflation, central banks raising rates = sell bonds" seems to be coming to an end. Although there may be another last hurrah as the US central bank looks to rein in the stock market optimism.
The mix of higher volatility, leading to deleveraging of risk parity trades and momentum means yields could yet go higher. We are invested for bond yields to reverse.
Asset allocation
After being very expensive for a number of years, stock markets are now merely expensive, in 85th percentile by value. Debt levels are extremely high. Earnings growth had been really strong but has come to a halt. There are signs it is starting to reverse.
Markets are supported to a great degree by central banks and governments. Policy error is every investor's number one risk.
But, any number of other factors could force this off course and see unexpected inflation. Energy prices could jump higher, increasing inflation. Chinese/developed world tensions might rise further, leading to more tariffs. Or, China might decide again to supercharge property investment.
We are significantly underweight Australian shares, and as noted above, overweight bonds, with the view that the Australian market is more quickly affected by rising interest rates and more affected by a global recession:

Performance Detail

Core International Performance
August saw increased volatility as uncertainty over interest rates and bond volatility spilled over to the equity markets. Our portfolio tracked the benchmark with Pharmaceuticals the stellar performer as our overweight positions in the obesity drug developers (Eli Lilly, Novo Nordisk) paid off handsomely. No changes this month though we are keeping watch on our Pharma exposures.

Core Australia Performance
Australian equities tracked lower as reporting season exposed some underwhelming growth profiles with Westfarmers the notable exception.

Portfolio Yields

This table shows the income yields of our various portfolios, including their proportion of Franking and Foreign tax paid over the past 12 months.
We also include an estimate of forecast yield (next 12 months), assuming no change in current tactical allocations and stock composition. There is an element of rising yields, as global interest rates rise. Offsetting that however, is the possibility Australian equity yields may fall as commodity-driven mining companies have lower profits to pay out. Our underweight Resource position in Core Australia portfolio should help maintain its yield.


