
Calendar year 2020 ended on a positive note with a Santa rally through December buoyed by vaccine optimism, the UK exit agreement, and the passing of a fiscal stimulus package in the US. Over the month stocks rallied when the US Congress made progress on the new fiscal stimulus bill but pulled back as talks seemed to stall. After some posturing, President Trump signed the new law, which helped stocks surge in the final week of trading.
The majority of industry sectors posted gains in December with Energy (+4.0%), Financials (+4.5%), and Technology (+5.1%) the standouts. Domestically the ASX 200 (1.2%) lagged global peers, but Australian small caps did materially better with a 2.8% return in December.
2020 was a year of two halves, as the external shock of COVID-19 was overwhelmed by central bank and government intervention. This propelled the market to record highs on the back of extreme valuations.
Key Questions for 2021
The two key upside risk questions for 2021:
- Will a mix of growing inequality, constraints on spending, central bank support and government financial support mean that excess liquidity/savings ends up bidding asset prices higher?
- Can ultra-low rates propel already high debt levels even higher?
We are currently expecting a yes for both questions.
The two key downside risk questions for 2021:
- Will central banks and governments continue to intervene in markets?
- Are there factors which can overwhelm the intervention?
The first question also appears to be a resounding yes. I really only pose the question as a reminder that markets are almost wholly reliant on central bank and government intervention.
There are some factors that could overwhelm the intervention, but none seem particularly likely. Most fall into the policy error camp.
Does valuation matter?
Yes. The answer is always yes. The real question is which measures of valuation are telling the full story?
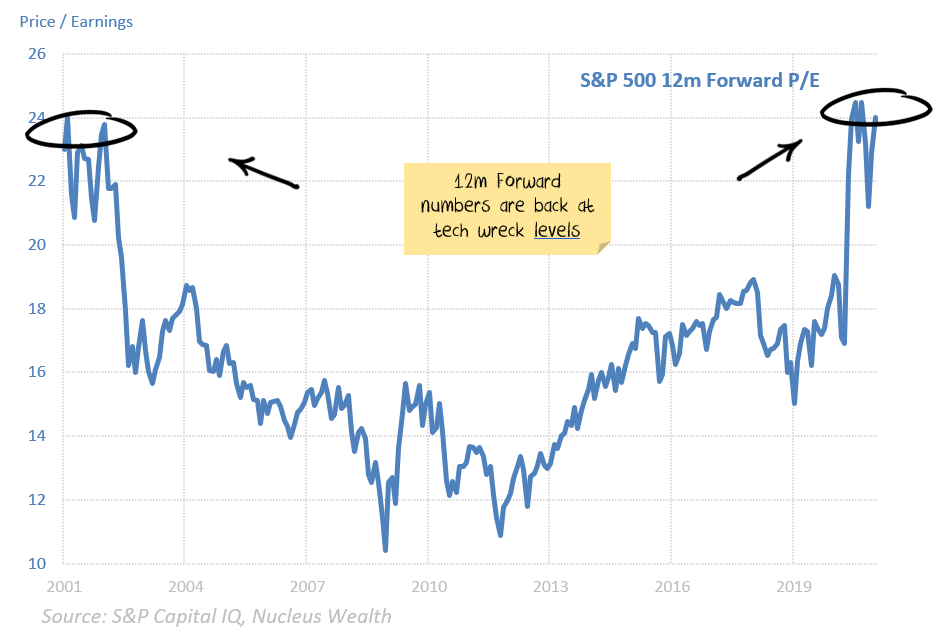
Let me start with the disclaimer. Market-wide valuation statistics have rarely been so uncertain. Earnings fell significantly for many companies due to COVID-19 and analysts are largely looking through these numbers at where companies can get back to.
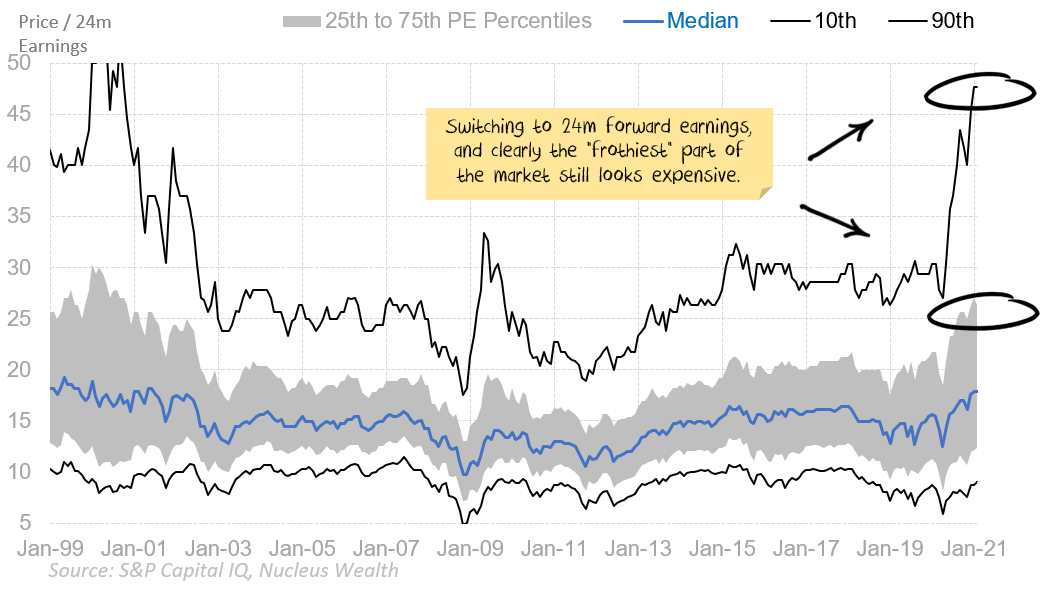
Typically we look at next 12-month forecast for companies, i.e. a standardised measure that adjusts companies with different balance dates. For large capitalisation companies, these numbers tend to be relatively accurate. However, these numbers are still affected by COVID-19, and it is better to look at the second 12 months (i.e. from 12 months to 24 months forward) to get a less distorted gauge of valuation. The disclaimer on these numbers is that they are not that accurate and tend to be overly optimistic. But at the moment they are the best we have.
If we look at the 75th and 90th percentiles (i.e. the most expensive 10% or 25% of stocks) then valuations still look very stretched. More than 10% of companies are trading on 45x their forecast earnings from two years in the future:
However, this is not the case uniformly across the market. The cheapest 25% of stocks are not particularly expensive relative to their past:
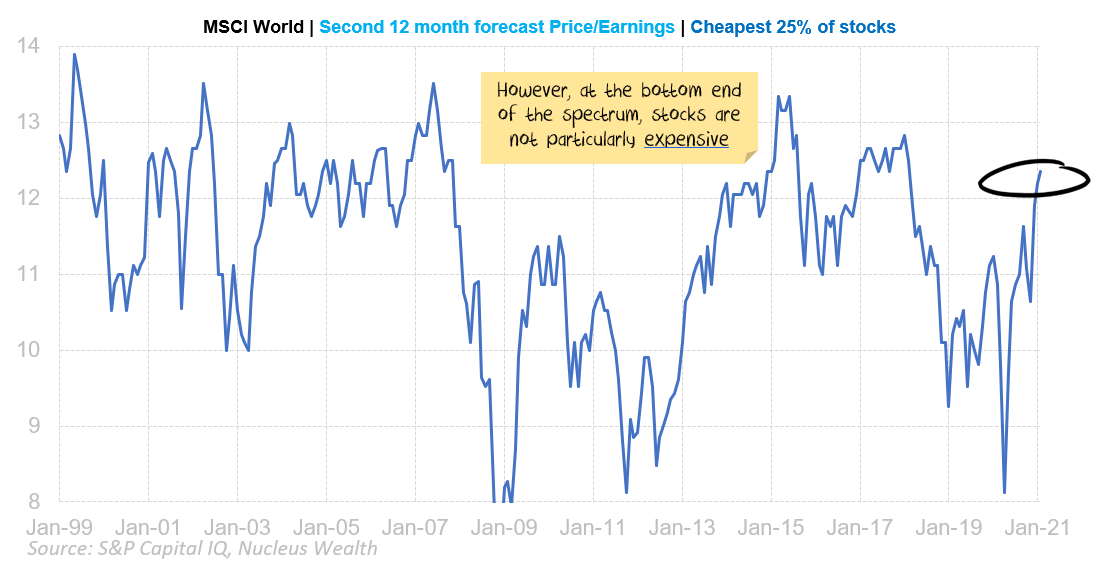
And it isn't just bottom-line earnings. Cashflow and other metrics are telling the same story. And indications so far are that profit growth will be stronger than forecast.
Which means there are still investment opportunities to take advantage of. But they aren't going to come in the average stock.
Tech Wreck Redux?
The upshot of the above is that the market is looking a lot like the tech boom. Following the tech boom in 2000, tech stocks fell almost 40%, yet value stocks actually rose.
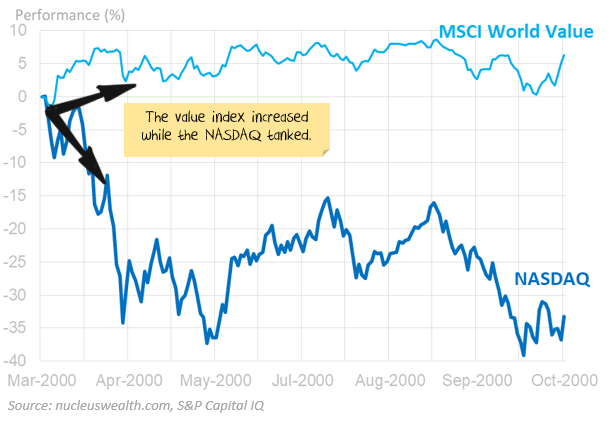
The S&P was relatively unchanged at the surface, but under the surface there were some sharp sector movements.
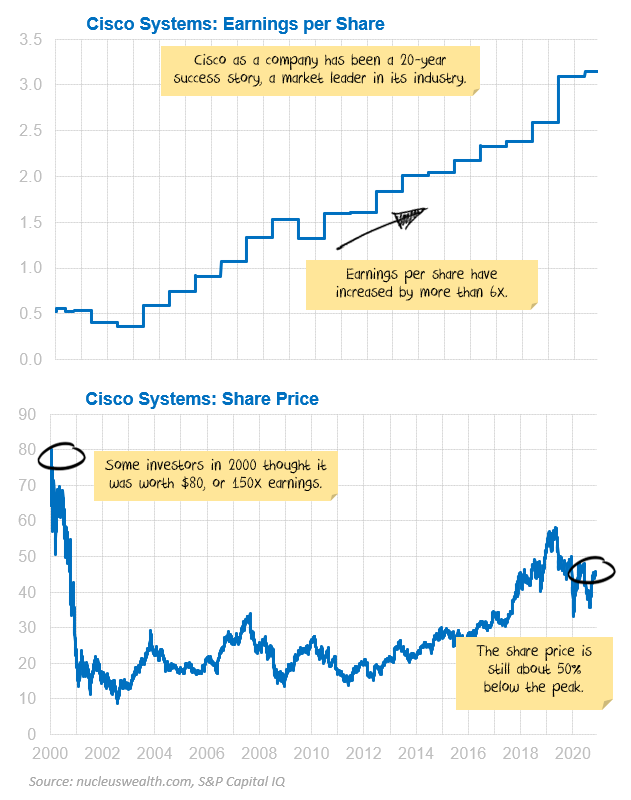
We are expecting something similar in 2021 - there are hundreds of stocks with great stories but terrible prices. Call them the Cisco of the 2020s. Great products, lots of growth, but the share price was just way overvalued:
Take Tesla, a car company that has caught the imagination of traders and is growing production quickly. It might spend the next 20 years increasing market share and growing earnings. But should it be worth (almost) more than every other car manufacturer combined? Probably not.
And Tesla is not the only one. There are hundreds of large companies on 40-50x 2023 earnings forecasts. Many will be great companies whose earnings will grow quickly. But not fast enough to justify the lofty valuations.
Asset allocation, diversification and the path forward
This leaves us, and the rest of the market with a quandary. Which expensive asset do you dislike the least?
Australian Government Bond yields are very low, but the yields are some of the highest in the developed world:
- If bond yields revert to long term averages, returns will be poor for investors. i.e. bonds are not an attractive asset over (say) 10 years.
- We expect economic growth to fizzle out in the face of gargantuan debt burdens and increasing inequality over the next 2-3 years. Which would mean Australian yields will fall (and the bond values rise) to similar levels that we see overseas. i.e. there is value (and diversification benefits) on a 2-3 year time frame.
- We are likely to see higher inflation over the next 12 months, partly from base effects, partly from short term shortages as growth bounces back. This is likely to be reflected in higher bond yields. i.e. there are risks over 6-12 months.
The net effect is that we are huddled at the short end of the bond yield curve where the Reserve Bank can protect us (and there isn't much risk anyway). We want to go back to the long end, but we are waiting for an inflation scare first.
The Australian dollar has run up significantly on the back of higher commodity prices and the reflation trade.
Given high commodity prices and Australia's significantly better COVID-19 experience, this probably has some time to run. The key risk is how much more China slows on the debt front. If China keeps the flow of easy credit then commodities and the Australian dollar could continue to rise. Recent signs are that China is being more circumspect about debt-driven growth.
We switched our portfolios to hold significantly more Australian stocks.
And to reduce our underweights to sectors (like financials and energy) that we believe will be medium-term losers but short term winners. This staunched the losses, and we will be looking to return to some of our more favoured exposures over the next few months. We are mainly targeting value stocks, the growth end of the market looks far too expensive.
We are looking at the higher Australian dollar as an opportunity to buy international stocks more cheaply.
Probably over the next six months. As with Australia, we are mainly targeting value stocks, the growth end of the market looks far too expensive.
Net Effect
Is that central banks are trying to force investors into higher-risk assets. We are walking a fine line between taking enough risk to move with markets, and holding enough protection in case of declines.
4th Quarter Reporting Season
Our thesis is that companies have cut costs significantly, and so will report higher profits on reduced sales. It is very early days. But the reporting season looks to be affirming our view.
Out of the 100+ large caps to have reported since mid-December, the median stock has grown by more than 10% vs 4th quarter 2019.
Median earnings surprise, which we measure as the actual result vs the expectation a month prior, is +13%. And forecasts are being revised upward.
Performance

Core International Performance
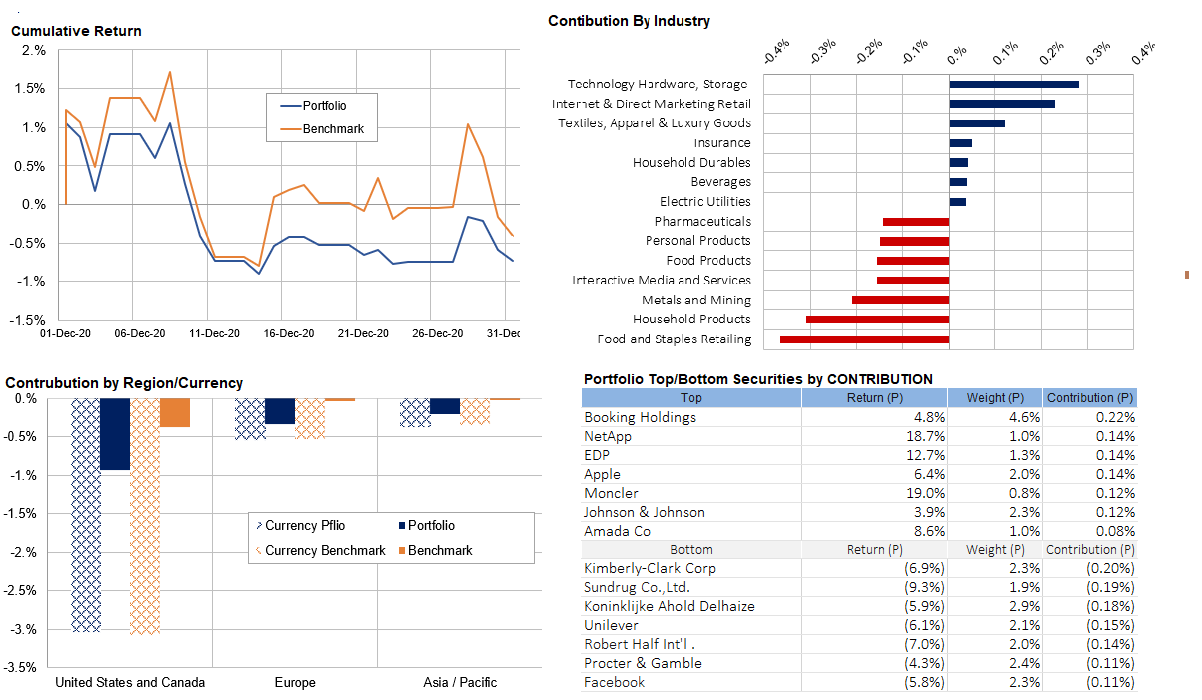
Our portfolio tracked below its benchmark over the month with the gap widening with the outperformance of the Energy and Financials stocks, two sectors we have been largely underweight. Currency continues to be a significant headwind as the strengthening AUD more than offset the home currency positive stock returns.
Early in the month, we repositioned the portfolio to take advantage of surging Financials and Value stocks. We also took some profits in Honeywell and Public Storage.
Core Australia Performance
The Core Australian portfolio tracked below its index over the month drag down by our overweight Travel exposure. Iron ore stocks did well, as did wine and pizza suppliers as the Sydney lockdown meant travel was off the agenda in the near term.
During December we significantly increased our exposure to Iron ore miner FMG and BHP, which now constitute more than 10% of the portfolio.

Tactical Portfolio Performance

The Tactical Growth Waterfall chart shows the weakness seen across all the asset classes over December.
Over the month we re-allocated around a third of the Bond exposure to Domestic Equities (especially resources and banks) as we expected the Santa rally to continue into January and the Australian dollar to remain strong.
Damien Klassen is Head of Investments at Nucleus Wealth.
Follow @DamienKlassen on Twitter or Linked In
The information on this blog contains general information and does not take into account your personal objectives, financial situation or needs. Past performance is not an indication of future performance. Damien Klassen is an authorised representative of Nucleus Wealth Management, a Corporate Authorised Representative of Nucleus Advice Pty Ltd - AFSL 515796.


