March 2020 Performance
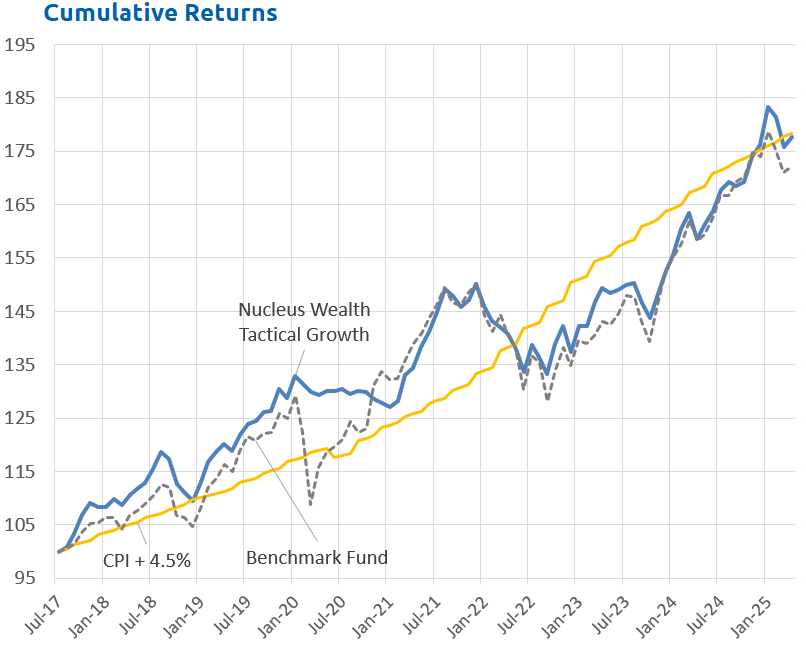
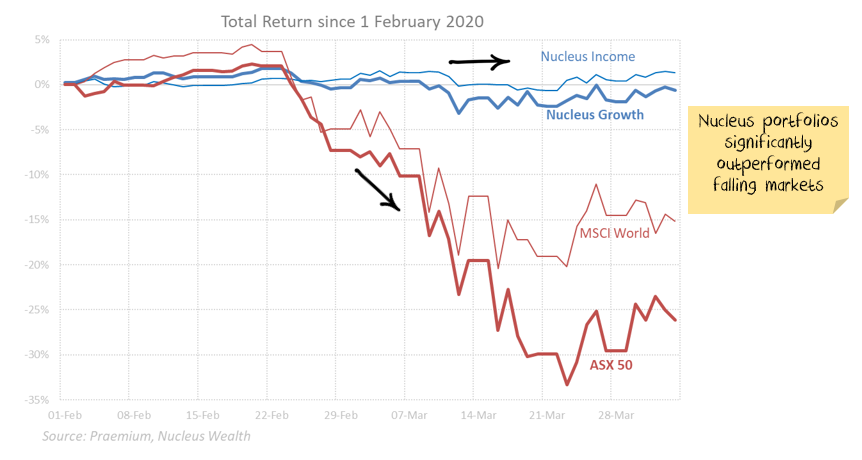
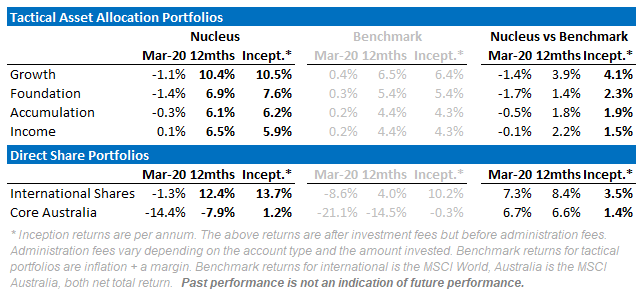
March was one of the worst months ever for stock markets. As discussed in our January and February reports, our portfolios were positioned for this outcome. Given we can only hold blue-chip liquid assets with no shorting or derivatives, our performance was as good as we could have hoped: Our tactical funds ranged from down 1.4% to up 0.1% vs stock markets down 20%+. In our direct equity portfolios, we have long preached the idea of holding a mix of quality and value to provide downside protection - and that showed this month. Our Australian fund beat its benchmark by 6.7%, our international fund beat its benchmark by 7.3% over the month.
From our January report:
Share valuations have not been this expensive since the tech wreck. Earnings growth is pretty close to zero. A supply shock is accruing in China. So is a demand shock. There are significant tail risks in corporate debt markets. And I haven't even got to the threat of a global pandemic.
We have made a lot of money for investors during the current cycle. In my view, now is not the time to be greedy and to try to squeeze the last drop of performance. Instead, we are taking cover to wait for a cheaper, and potentially much cheaper, opportunity to buy shares.
We are now being given the opportunity to buy shares at a much cheaper price. We are not yet convinced the time is right.
Early report
Acknowledging the heightened concern around investments at this point in time, we put this report out early.
At this stage, we don't have the figures from other superannuation funds to compare to. We will publish an update later in the month when they are released. Initial indications are that we will once again substantially outperform. However, I note most superannuation funds have significant unlisted assets, and I expect they will use these to "smooth" their performance.
Investment Outlook: Virus Statistics
Our COVID-19 analysis has been through three phases. The first was about looking for data and statistics showing whether COVID-19 would spread. The second phase was about assessing outbreaks, how large and deadly they would be. These questions are no longer in doubt. Now it is now about determining when the virus will peak and how long shutdowns will be in place.
- How many COVID-19 cases are there? We believe the headline case statistics are not useful for comparison due to a range of collection issues. We focus on severe/critical hospitalisation statistics as a better measure. China, Iran and Italy all have significant question marks over their COVID-19 statistics.
- Is Winter an issue? Likely. But with a big disclaimer. Summer and Tropical countries are lagging Winter countries in absolute numbers which probably means a heat/light/humidity factor. But the growth rates are very similar now. My best estimate is there is some benefit, but the benefit can easily be wasted if (when?) governments are slow to act.
- What is an acceptable level of hospitalisations? There is a trade-off between economic activity and health outcomes. We are mostly a supporter of the views expressed in the hammer and the dance: you need the “hammer” of harsh shutdowns for a few weeks followed by a “dance” of increasing/decreasing quarantine measures to keep the disease at bay. We believe countries will (eventually) aim to maximise the amount of economic activity that doesn’t overwhelm their hospital systems. We are using 25% of Intensive Care Unit or hospital capacity as a rough estimate.
- When will COVID-19 peak? We are looking at five main factors which will determine the outcome: aggressive testing, aggressive case tracking, widespread face mask use, strict shutdowns, gradual re-opening. We suspect if countries tick all the boxes then 4 weeks of hard shutdown followed by 4 months of reduced activity will reduce transmission to treatable levels. However, we also suspect the semi-shutdowns we are seeing in most developed countries will extend those time-frames significantly.
Question 1: How many COVID-19 cases are there?
There are four main gaps between reported cases and actual cases:
- Insufficient testing: Countries that do not have the systems or capacity to test properly
- Yet to be reported cases: People who have the virus but are either: yet to show symptoms, yet to be tested, or had a test that showed a false negative
- Asymptomatic cases: Estimates are that around half of all people who get the virus will never show symptoms
- Deliberately under-reported: Some countries look to be deliberately under-reporting cases
The net result is the number of global cases is likely to be so significantly different from reported statistics. Recent estimates are that global infections are as much as 500% to 1,000% higher than reported. Which basically makes any aggregated reported numbers useless.
We started our analysis in January by excluding Wuhan data, then all Chinese data. Then Iranian data looked suspect. Then Italy changed definitions to under-report cases. After that, we gave up on aggregates and focussed on individual countries. At least that way, changes would be based on a relatively consistent methodology.
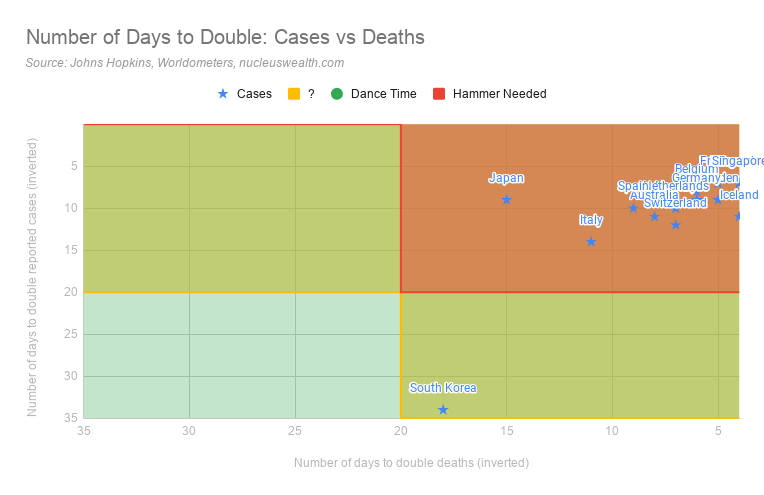
Ideally, testing would be randomised, significant in size and from a trustworthy source. Iceland, Norway, Australia, Germany and South Korea (in green below) rate the best. Switzerland, Italy, Japan, US and Netherlands (in red below) rank poorly. Dashed lines are countries with widespread face-mask use.
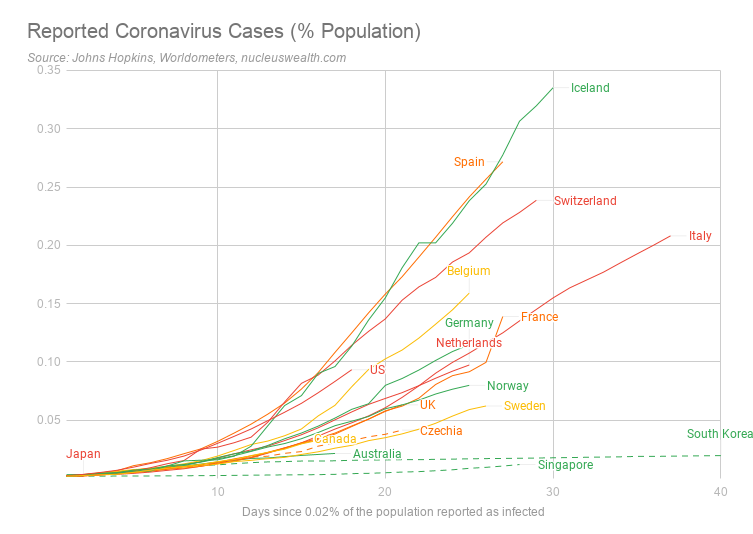
The above chart is misleading. For example, Iceland rates at the top, but not because it has the most number of severe cases. Instead, Iceland rates highly as it has been doing far more testing – including random sampling.
We are focussed now more on the number of critical or severe cases. While the definition of these will vary between countries, they are likely to represent hospitalisations which we believe are a better indication of the current severity.

Note also these are a measure of the current active numbers. Total case numbers can only increase, but these numbers can decrease as sick people either die or are cured and are removed from the count. So, it represents a better indication of the stress on the hospital system.
Countries outside the G12 that we included are:
- Czechia (formerly the Czech Republic) as an interesting European case which has implemented mandatory mask-wearing and looks to be coping much better than other European countries
- Singapore and South Korea who both have widespread mask use and aggressive contact tracing
- Iceland as it engaged in a randomised test of 5% of its citizens and so represents the most complete dataset globally
- Norway as it is starting randomised testing.
Stock markets will likely be focussed on the aggregate number of new cases and deaths in advanced countries. We are of the view that a reduction in cases/deaths will not be the end of the larger bear market in stocks due to debt and unemployment constraints. However, we suspect a sustained reduction in cases/deaths will be the start of a bear market rally.

Question 2: Is Winter an issue?
At the moment our base case is coronavirus is worse in winter but delayed or poor responses in tropical or summer countries can offset most of the benefit.
We split cases into:
- Northern Hemisphere Countries that are now in spring and are getting warmer
- Tropical countries: Countries near the equator where temperatures are relatively high all year
- Southern Hemisphere Countries now in autumn and are getting colder
In aggregate numbers the differences are still stark:
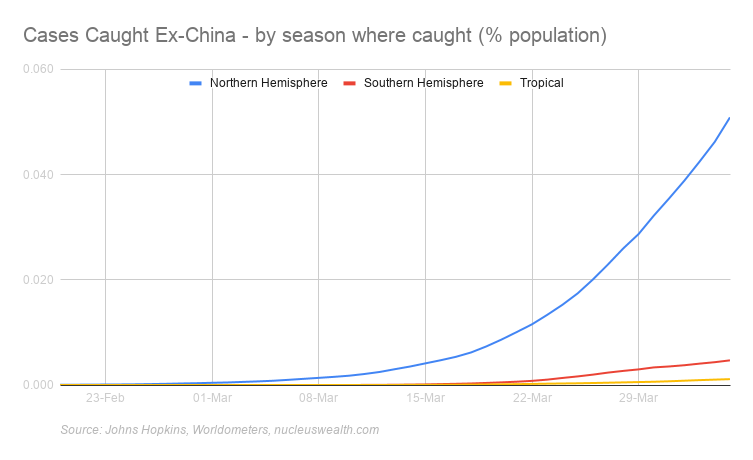
The COVID-19 statistics in these charts are based on where the case was caught. For example, as at 01-Mar two-thirds of the cases in Thailand were caught in China or Iran but diagnosed in Thailand. So, in that example, one-third of cases are allocated to Equatorial and two-thirds to Winter.
There are suggestions that UV-B radiation and vitamin D played a role in reducing deaths in the Spanish Flu pandemic. Other studies suggest humidity greatly reduces the aerosol transmission of viruses, but some suggest humidity increases the surface transmission. It is unknown how these affect COVID-19.
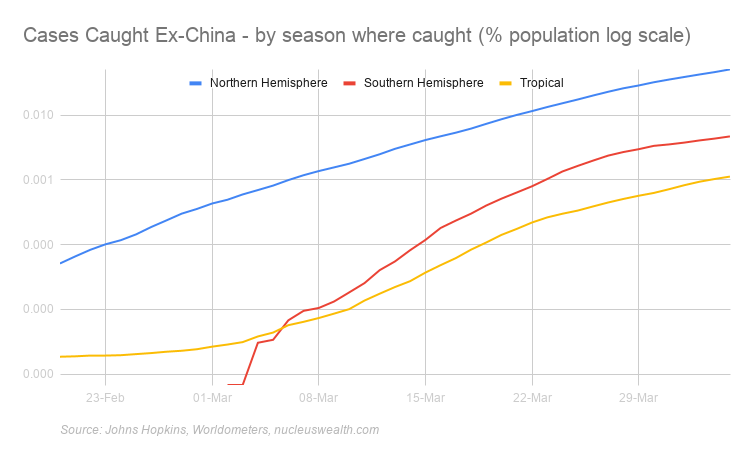
The below charts are the pessimistic take on the summer/winter divide. Cases are spreading just as quickly and tropical countries are sustaining significant outbreaks. Also, a number of large population tropical countries have poorer testing/reporting:
Question 3: What level of hospitalisation is acceptable?
We note the economic trade-off:
- Humanitarian. The bigger the shutdowns, the greater the preventative measures, the fewer people will die.
- Economic. The bigger the shutdowns, the greater the preventative measures, the more significant the economic impact will be.
We are of the view that governments around the world are experimenting, trying varying levels of shutdowns to get hospitalizations down to a level that does not overwhelm the healthcare system.
As Tomas Pueyo eloquently puts it, the solution is in two forms, the Hammer and the Dance:
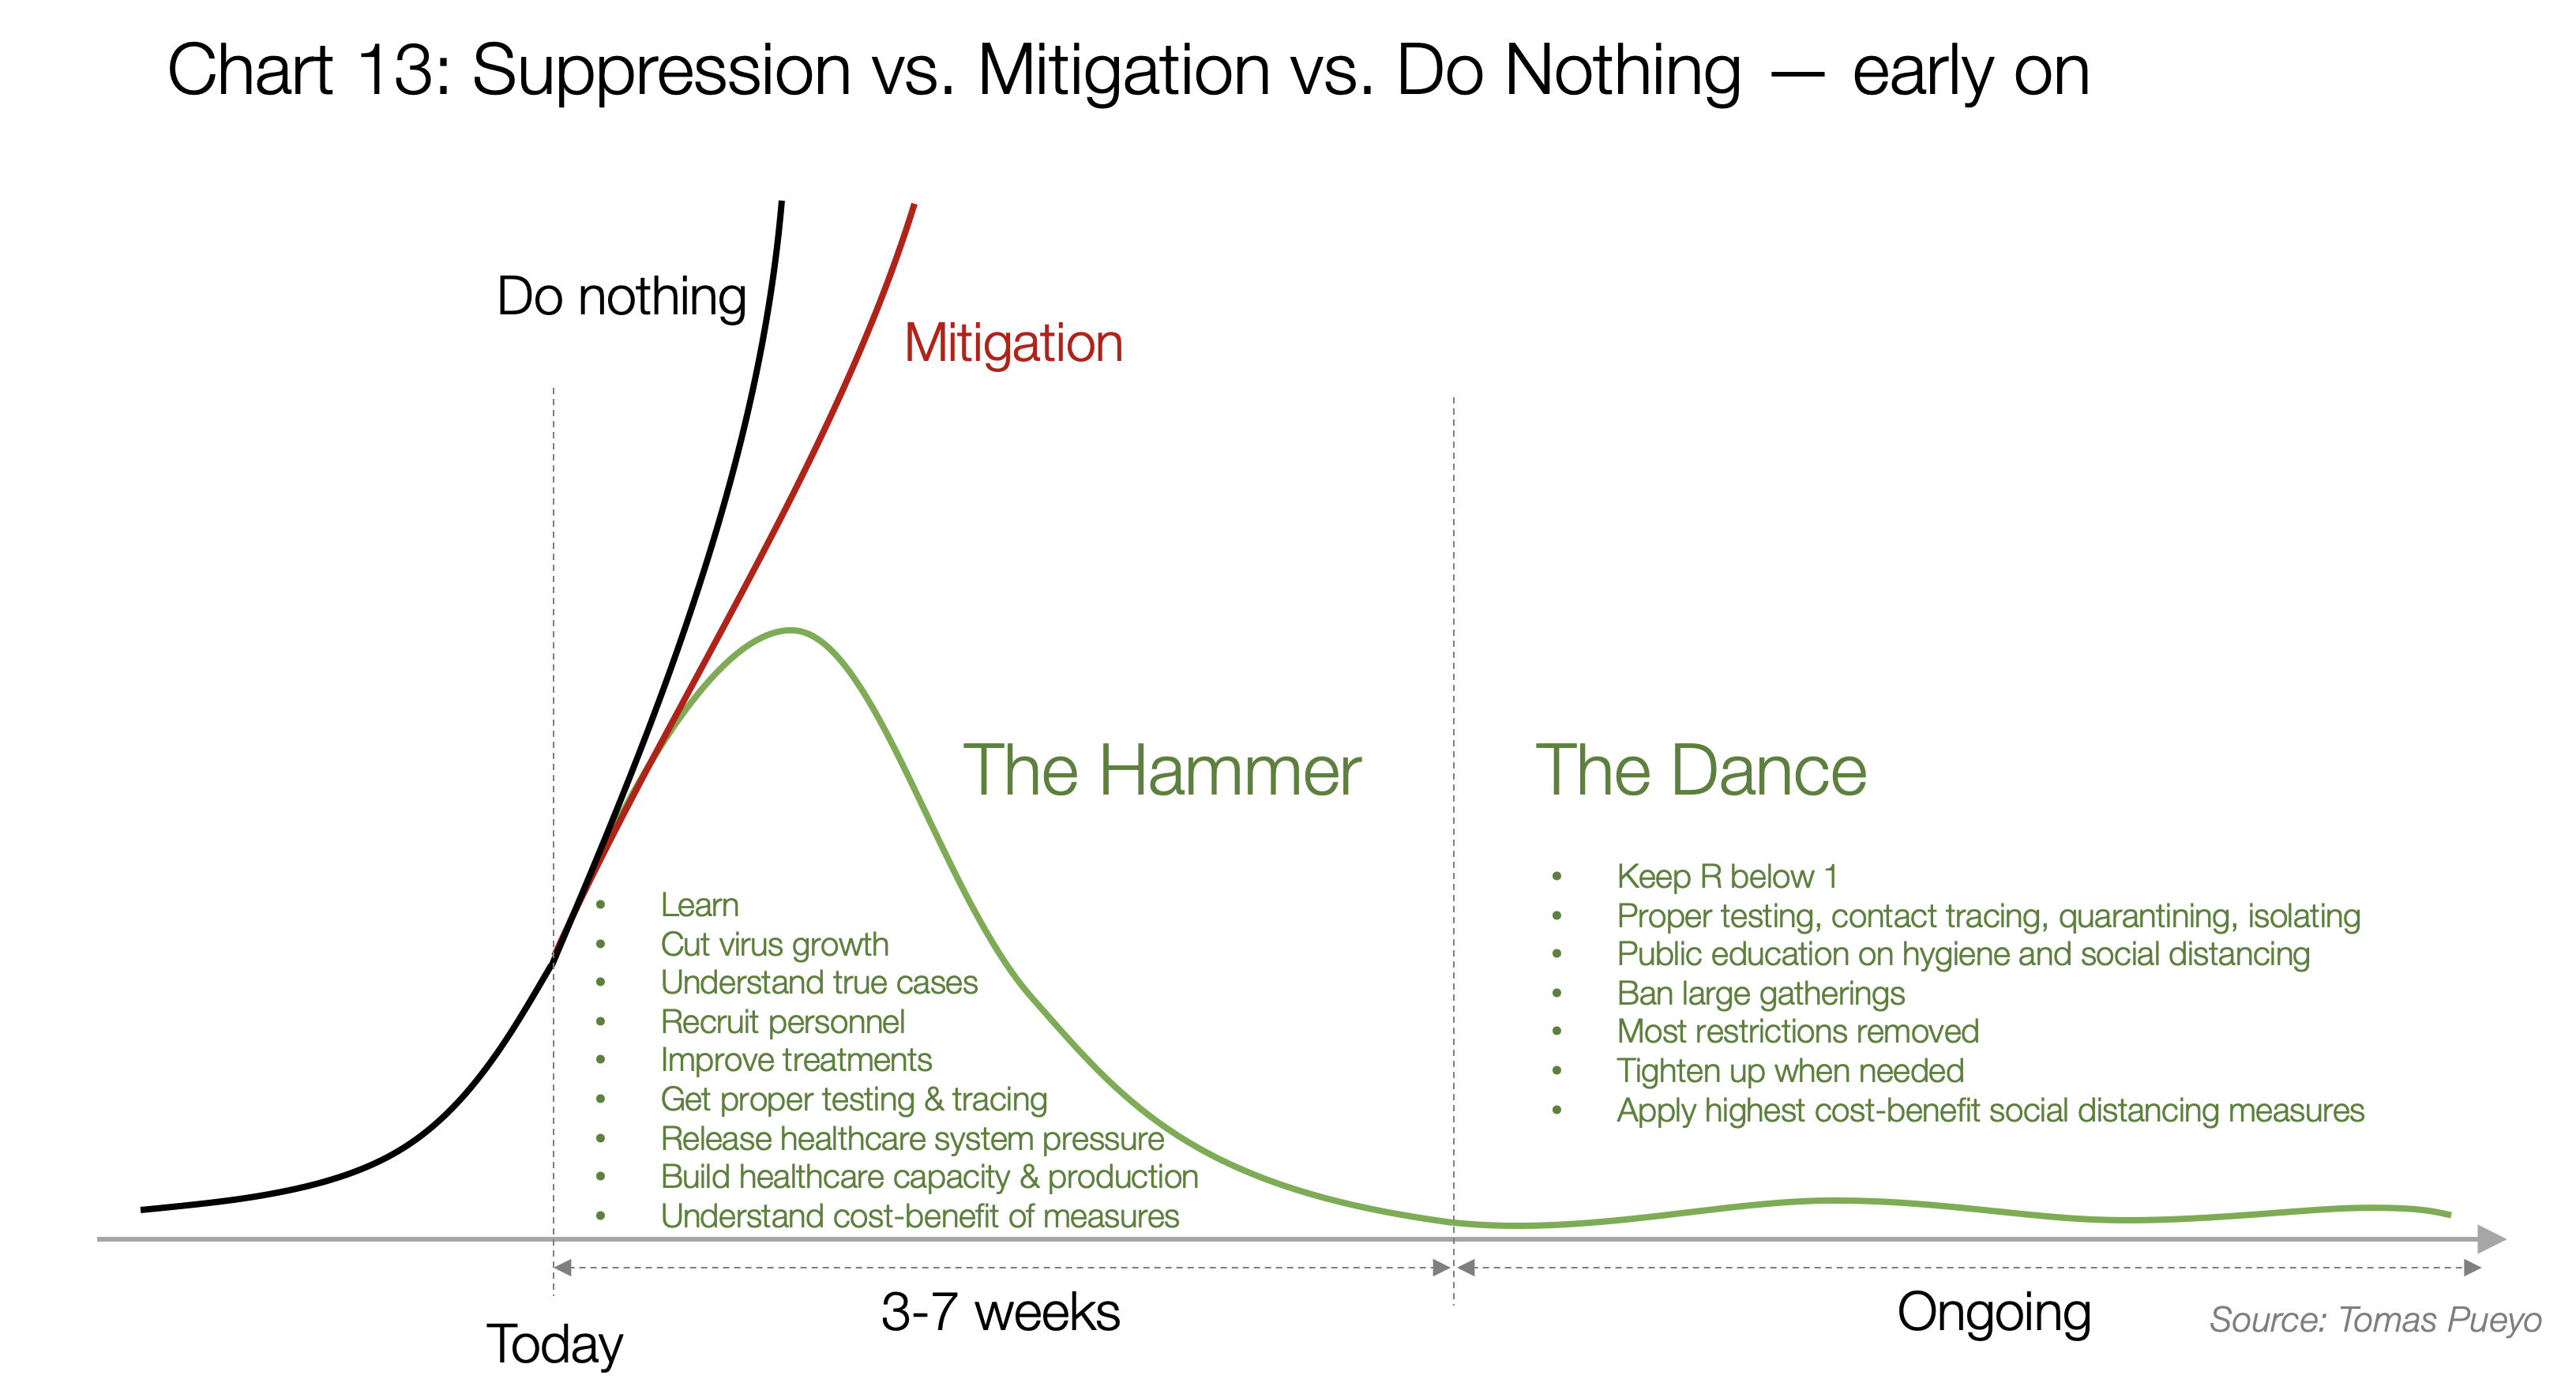
We are making the assumption that governments will eventually come to the same conclusion.
To get cases down to an acceptable level, the Hammer is needed. Then the Dance begins where governments will need to adding capacity and mitigation strategies while gradually opening up.
South Korea has probably been the best example.
So what level of hospitalisation is acceptable during the dance?
We are assuming that an acceptable level of hospitalisations is around 25% of existing beds or intensive care units. This accounts for regular patients and case clustering. So, the target needs to be considerably lower than the capacity.
We estimate:
- it takes about two weeks for patients to die.
- it takes four weeks for patients hospitalised to be released.
- about a quarter of hospitalisations need to be admitted to intensive care.
So new patients will need to be below 4% of capacity each day. As Intensive Care Unit beds are created and treatments become more effective this will improve.
There are two ways to look at whether a country needs the hammer or whether it can advance to the dance.
Hammer/Dance 1: Is the hospital system is overwhelmed?
We have used the capacity available prior to the coronavirus outbreak to assess this measure. While many countries are adding temporary capacity to deal with patients, these are emergency measures. If we are looking at an extended period before vaccines are available then coronavirus patients should take up only a relatively low proportion of a country’s intensive care beds:

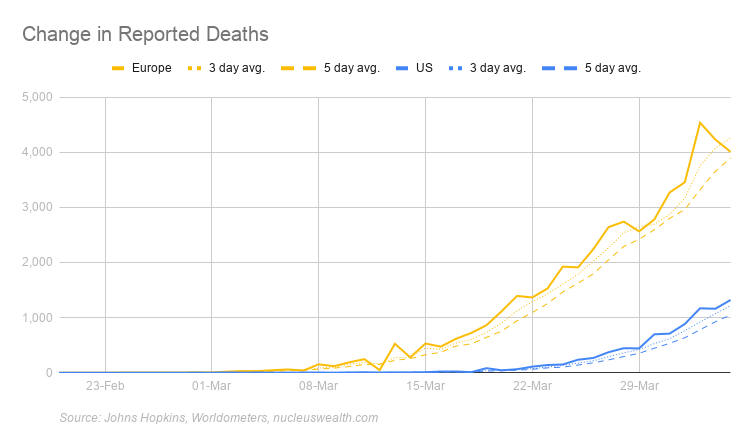
Hammer/Dance 2: How fast are cases and deaths growing?
The second is the speed of growth of cases and deaths. If cases are quickly growing then the hospital system will be overwhelmed, even if it is currently coping.
Question 4: How long will COVID-19 last?
We are looking at five main factors will determine the outcome: aggressive testing, aggressive case tracking, widespread face mask use, strict shutdowns, gradual re-opening. We suspect if countries tick all the boxes then 4 weeks of hard shutdown followed by 4 months of reduced activity will reduce transmission to treatable levels. However, we also suspect the semi-shutdowns we are seeing in most developed countries will extend those time-frames significantly.
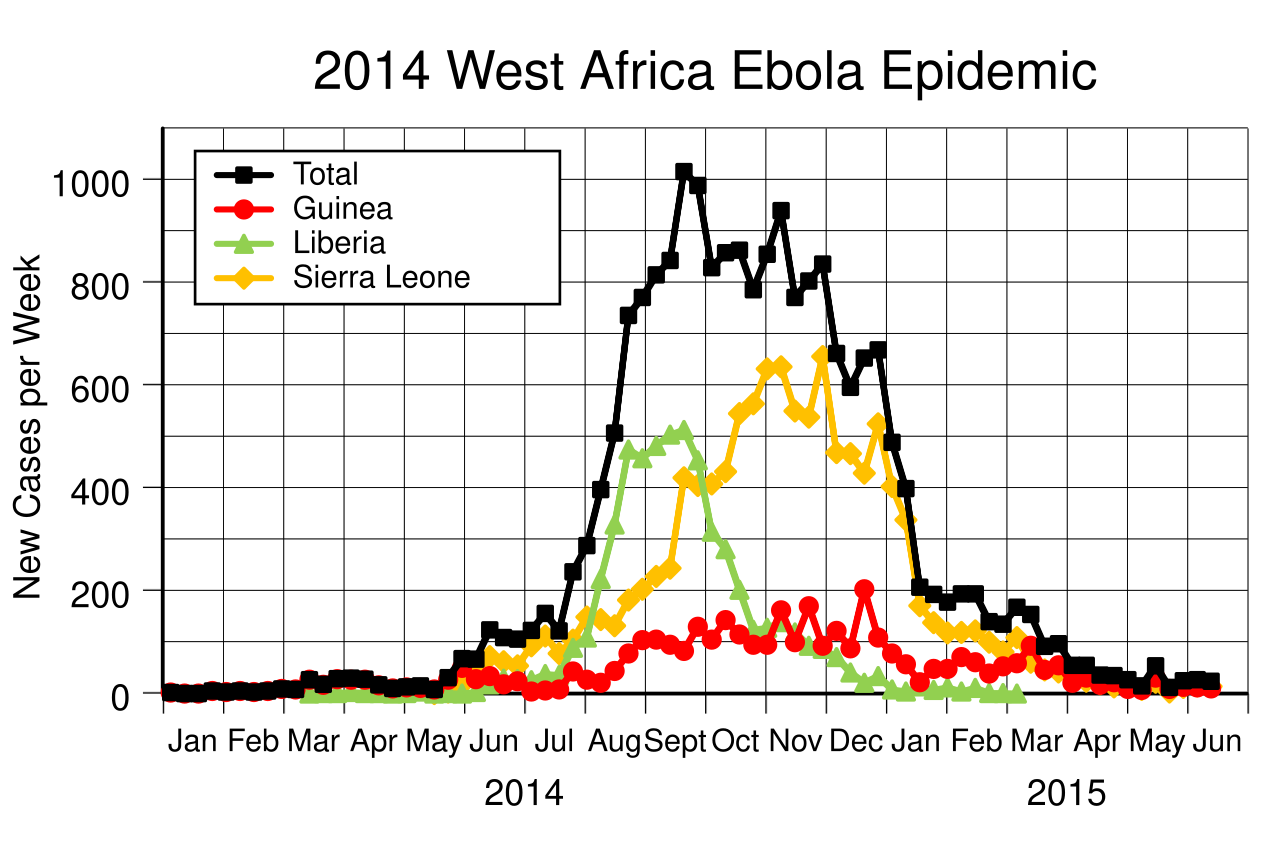
The key factor is if epidemics get out of control, then they can be over relatively quickly in a single location: six weeks to two months (with a lot of deaths). However, if quarantines and shutdowns manage to slow the disease, the epidemic can last for considerably longer. The best that could be expected is probably three months. More likely to be multiples of that.
Because there are multiple locations across multiple countries, it is likely to last considerably longer, and there may be multiple waves.
Here are some sample epidemics showing the effect at a city, country and global level:
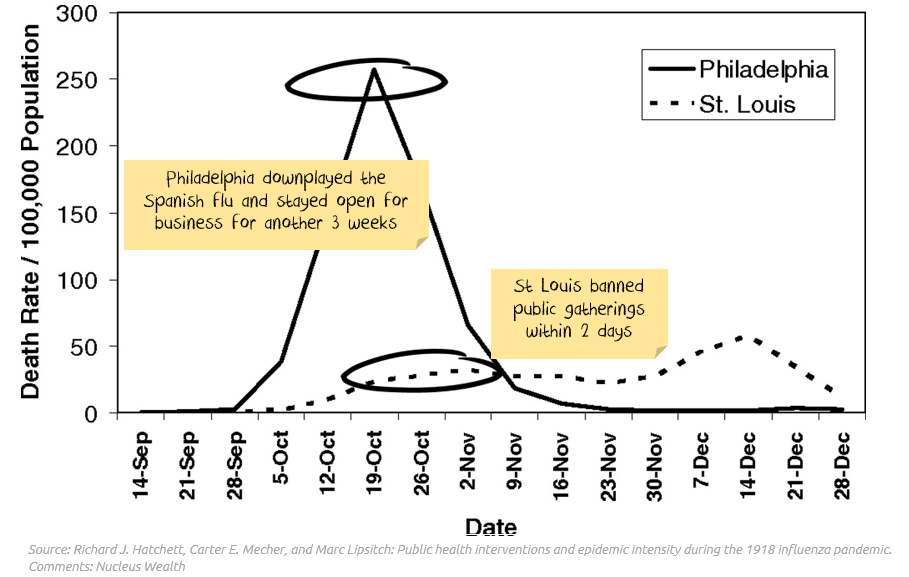
1918 Spanish Flu Epidemic: Comparing death rates in individual cities

Investment Outlook: Economic Effects
Corporate debt and unemployment hold the key
We know:
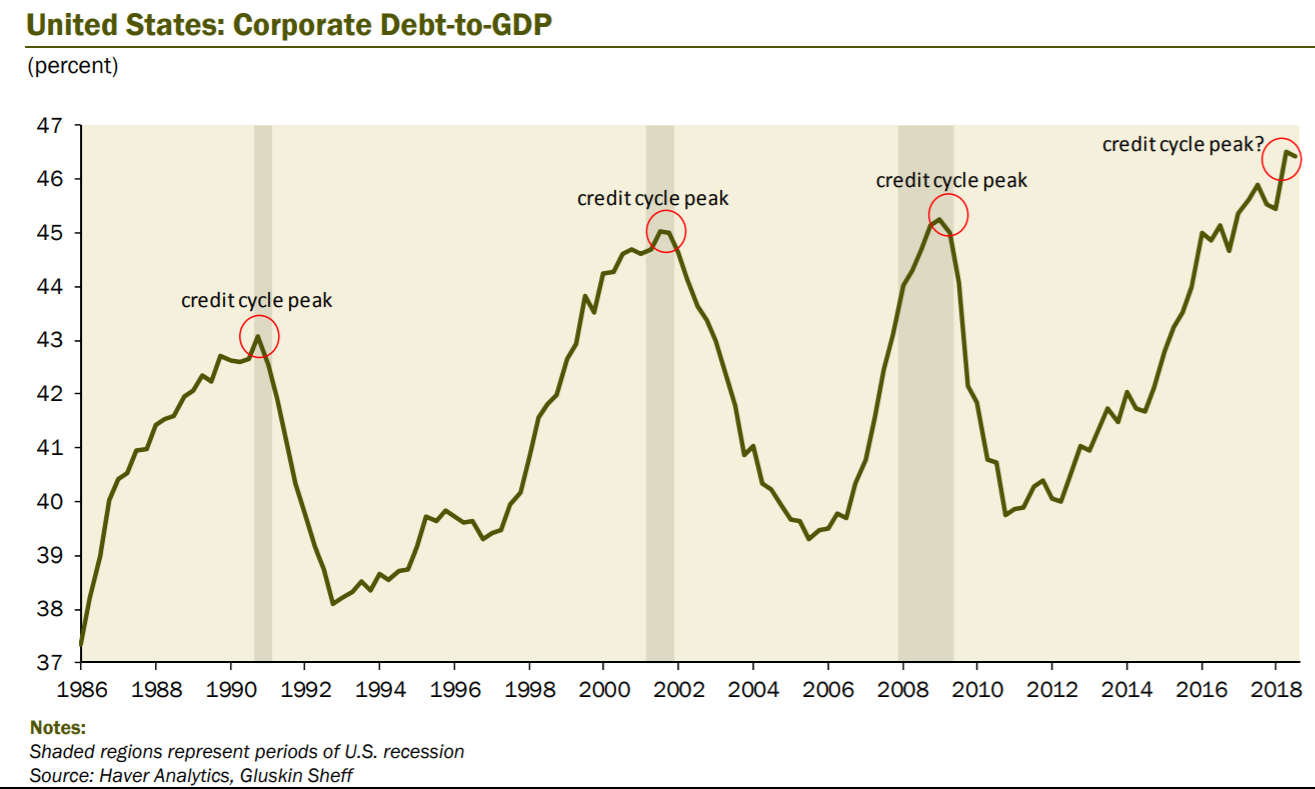
- Corporate debt is at all-time highs
- Many companies run "just in time" inventory and have very little slack in the supply chain
- The end of the corporate debt cycle almost always results in a recession
- There is a supply shock for companies from shutdowns and quarantines
- There is a demand shock for companies from closures and quarantines
- Unemployment is rocketing higher
Even if a cure was found today, there will still be significant corporate defaults.
Debt crises are inherently non-linear. Companies go bust all the time, but don't create a debt crisis.
However, if (a) loans are being offered too cheaply and (b) there are enough defaults (or one or two significant, high profile defaults), then:
- the interest rates increase in the corporate debt market as participants remember the risks
- loans become harder to get and/or rollover
- this will mean other companies will also default
- interest rates will go even higher, loans harder to get
- and so on, spiralling into a debt crisis.
Credit markets are closed. This risk of the above scenario is increasing. Central banks are freeing up lending to higher-rated corporates, but we can't see a plausible scenario which results in no debt crisis for companies.
This risk is a clear and present danger to markets – regardless of the further spread of COVID-19.
The most common bullish argument is:
- COVID-19 is will be over shortly and markets will bounce back with pent up demand
- There will be so much fiscal and monetary stimulus that stock markets will go higher
The first argument looks shaky. The second relies on fiscal stimulus convincing shell-shocked companies and consumers to spend money. We think this unlikely.
It is likely the stimulus won't be enough to replace the lost demand. After being through a complete quarantine/lockdown, my expectation is consumer spending will be muted for months and maybe even years.
If a gigantic government stimulus eventuates, then we will reconsider based on how expensive the market is and how targetted the stimulus is. At the moment, with an expensive market and unknown stimulus, discretion is the better part of valour.
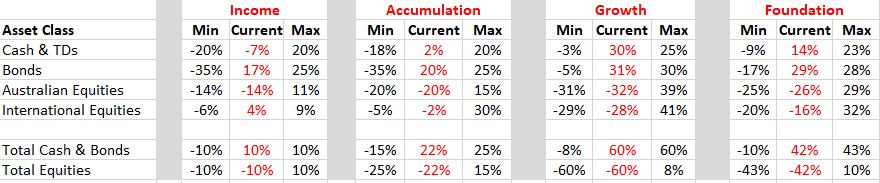
Asset Allocation
Our portfolios "went to ground" before the crisis hit, selling stocks and investing in bonds/cash/international currencies. All of our funds are at minimum weight to shares. This is a significant deviation and one that we have not undertaken lightly. So far it has been the right move.
How far can stock markets fall?
This is the million-dollar question.
The decision in January/February was relatively easy: markets at highs not seen since the tech-wreck, no earning growth, a looming supply and demand shocks, and a possible pandemic. Sell. There was no need to put an exact figure on how far markets would fall as they were clearly too expensive.
We are still not ready.
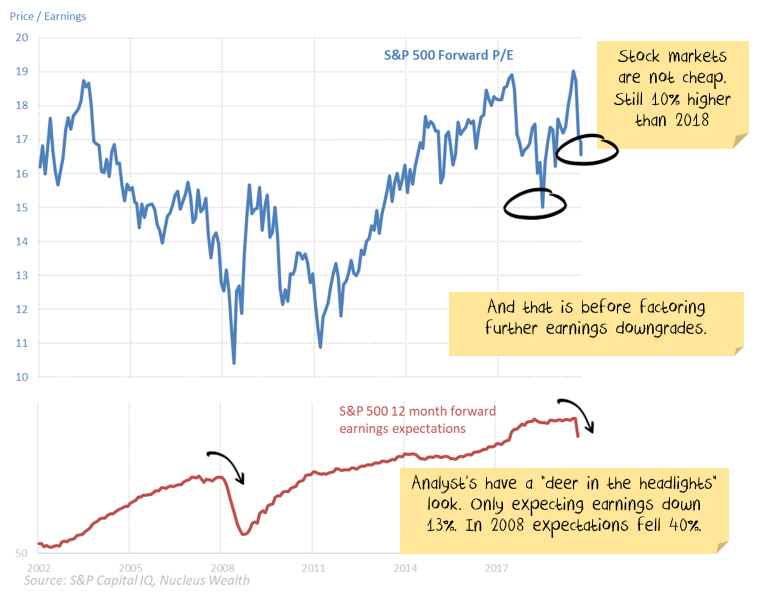
If you made the optimistic assumption that earnings will only fall about half what they fell in 2008, then share markets can fall another 15% and still only be very slightly cheap.
And even if you don't think a debt crisis is likely, then it is easy to see reasons for earnings to fall:
- Companies adding more slack into supply chains so they can handle disruption better
- Companies reducing debt after seeing other companies run into trouble
- Companies re-working supply chains to reduce reliance on China
- Reduced demand
The case for becoming bullish will depend on:
- How severe the outbreaks are in the US and Europe
- Whether there is a corporate debt crisis
- How significant and well targetted the fiscal stimulus is from governments, particularly the US, China and Germany.
I suspect if you buy shares now then in ten years time you will be pleased with the decision. I'm not convinced you will be pleased in ten months time.
Damien Klassen is Head of Investments at Nucleus Wealth.
Follow @DamienKlassen on Twitter or Linked In
The information on this blog contains general information and does not take into account your personal objectives, financial situation or needs. Past performance is not an indication of future performance. Damien Klassen is an authorised representative of Nucleus Wealth Management, a Corporate Authorised Representative of Nucleus Advice Pty Ltd - AFSL 515796.