
2021 began with optimism. After Victoria beat off its virus second wave, Australia was effectively virus free with the economy primed to boom on the back of pent-up demand and the unprecedented stimulus saved by households that had yet to be unleashed on the economy.
The first half of 2021 saw GDP and consumption spending post a V-shaped recovery, while Australia's unemployment rate cratered to just 4.5% - the lowest recorded level since the Global Financial Crisis (GFC) hit in 2008.
Alas, the recovery was turned upside down when the Delta COVID strain arrived in Sydney in June, before spreading to regional NSW, Victoria and the ACT. Before long, half of the nation's population was plunged into a long and painful lockdown.
Consumption spending immediately dropped, jobs were lost, and Australia's GDP again turned negative.
Now with all three jurisdictions open once more, vaccination rates approaching 'world's best' levels, and the dismantling of state and international borders, Australia again finds itself on the verge of another strong recovery.
Baring further major lockdowns from Omicron and other new sinister virus strains, 2022 is shaping up as a strong year for the Australian economy reminiscent of the first half of 2021. But as we typed this report, the emergence of the Omicron strain had caused tightening restrictions and the beginning of lockdowns across Europe. If this is replicated in Australia, then it risks thwarting the economy's imminent rebound.
No matter what unfolds over the short term, what lies ahead in 2023 and beyond is more worrying. Despite an impending election campaign in the first half of 2022, Australia appears committed to repeat the same policy mistakes and poor outcomes that were experienced over the 2010s "lost decade" whereby the economy and living standards stagnated in per capita terms.
2022 poised for a W-shaped rebound:
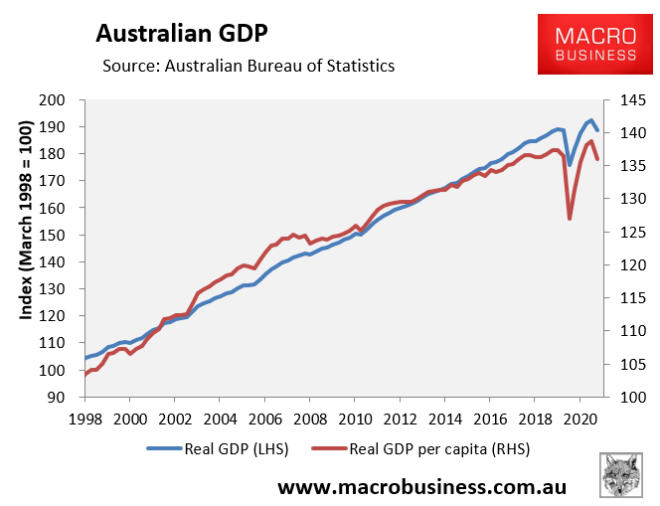
The September quarter national accounts, released earlier this month, were a predictably dour affair with hard lockdowns across New South Wales, Victoria and the ACT - effectively half the nation's population - driving a 1.9% fall in Australia's Gross Domestic Product (GDP):

This left Australia's real GDP tracking 0.2% below its December 2019 peak, whereas GDP per capita was tracking 1.0% lower:
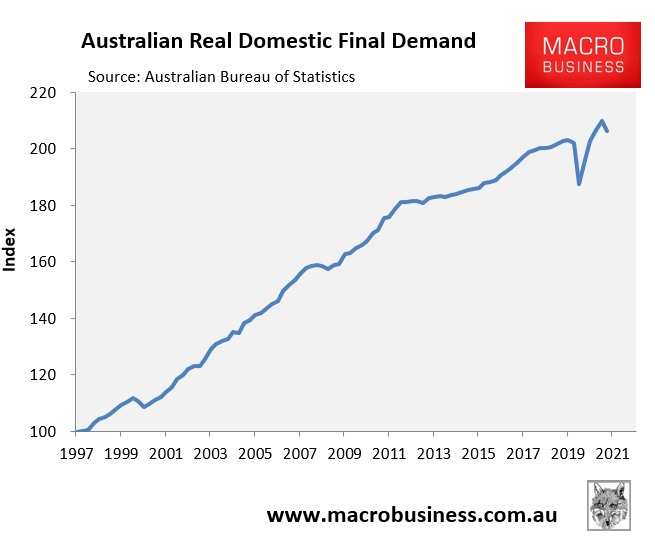
The outcome was similar with respect to real final demand (effectively GDP minus net exports), which fell 1.8% over the September quarter but was 1.4% above its December 2019 level:
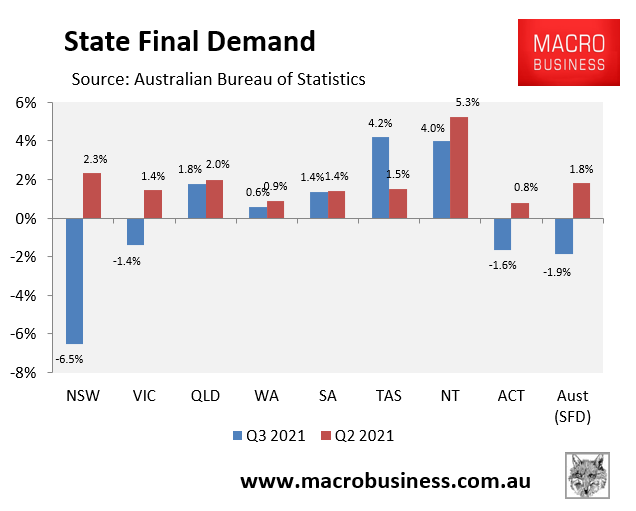
As expected, the lockdown jurisdictions drove the decline in final demand nationally, whereas the virus-free states each experienced solid growth:
The outlook for the economy headed into 2022 is positive.
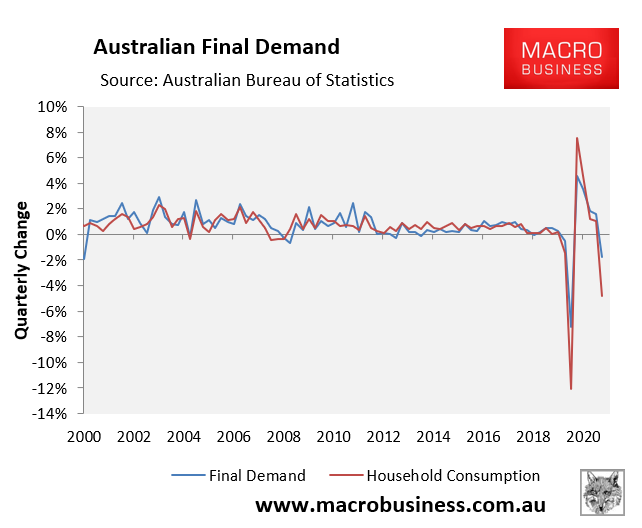
Household consumption is by far the biggest driver of the nation's economic growth, accounting for around 55% of final demand in a typical quarter. Therefore, where household consumption goes, the economy usually follows:
The hard lockdowns experienced across NSW, Victoria and the ACT over Q3 prevented households from spending at the same time as billions of dollars of additional income support was provided to households (chart from Deloitte):
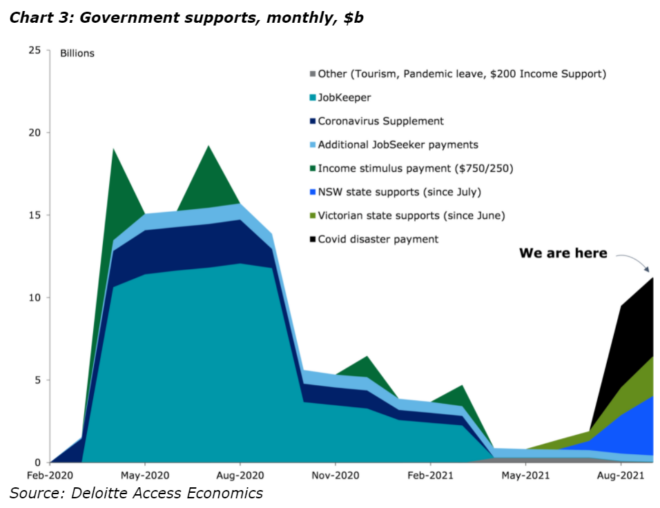
Household income boomed while expenditure was artificially reduced:
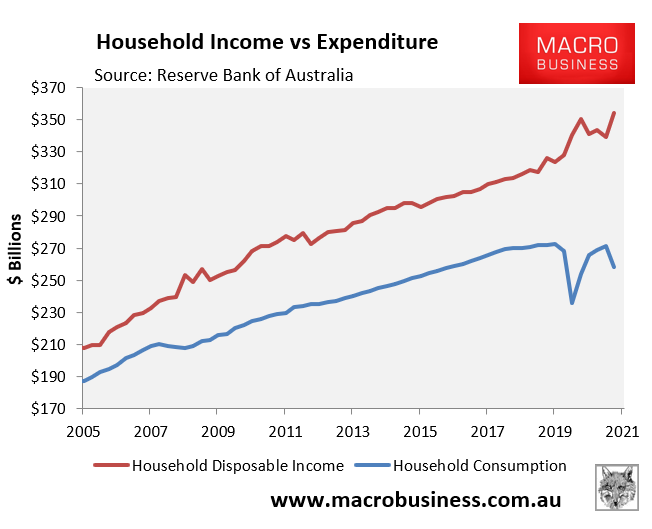
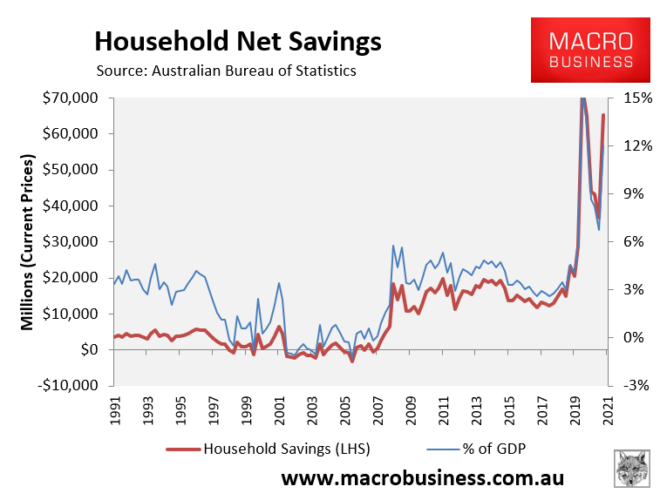
The inevitable result was that household savings once again soared, with households banking a whopping $65.2 billion in Q3 - equivalent to 12.0% of Australia's GDP:
In fact, over the six quarters since the pandemic began, Australia's households banked an extraordinary $327 billion of savings - a massive increase from the $119 billion saved in the six quarters prior:
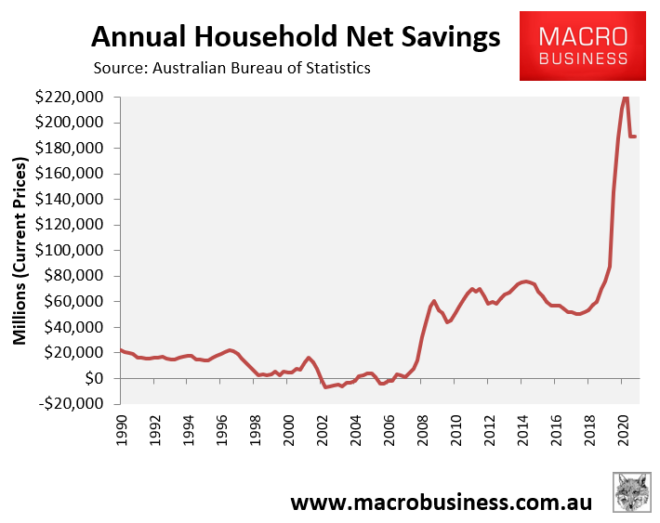
The upshot is that with so much money saved, and households now free to spend, the Australian economy should experience a huge lift in household consumption spending over coming quarters, which will power economic growth.
Australian households will also be supported by one of the tightest labour markets on record, as illustrated clearly by the sharp decline in the ratio of unemployed and underutilised workers per job vacancy, which are tracking near all-time lows:
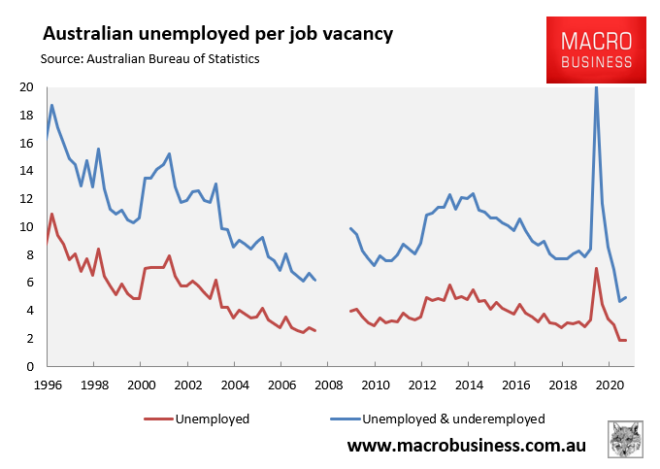
In short, the primary reason why Australian households have saved so much is because they were prevented from spending due to COVID-19 lockdowns and restrictions. As these barriers have now been removed, these same households are likely to go on a spending spree in 2022 (as hey did in the first half of 2021), in turn driving another strong economic rebound.
That is provided there are no significant further lockdowns. If there are, the outlook becomes shaped by how much of that demand is suppressed, and how much further stimulus the government deploys.
Construction spending will also boom in 2022:
Construction activity was already running strong in 2021. As shown in the next chart, total gross fixed capital formation grew by 12.6% in the year to September, driven by both the public (11.7% growth) and private (12.9% growth) sectors:
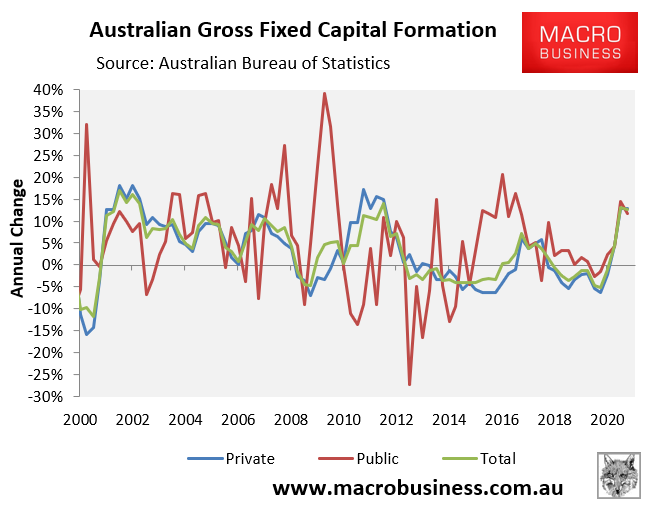
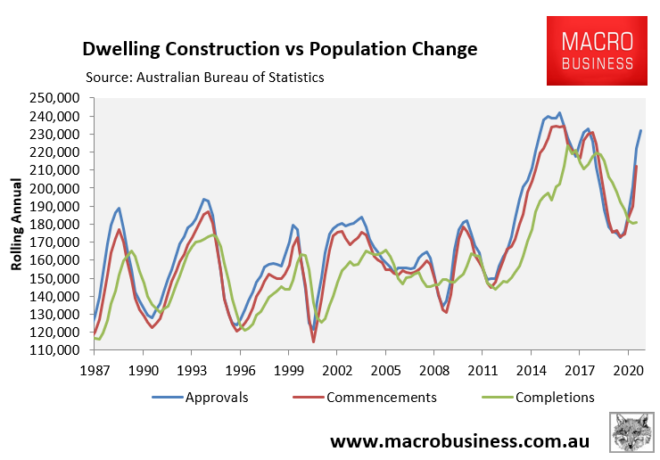
Indicators suggest that construction activity will remain strong in 2022, given there is still a massive pipeline of dwellings that have been approved by not yet built:
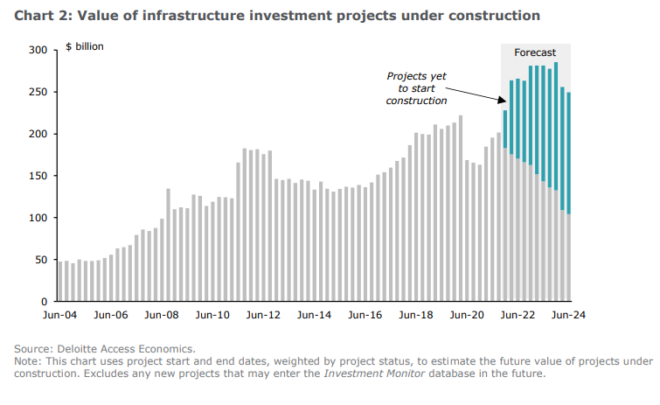
Deloitte has also forecast record infrastructure construction next year:
Therefore, the ingredients are in place for a strong 2022 for the Australian economy. Our worry is what comes afterwards in 2023 and beyond.
Australia is sowing the seeds of another lost decade:
In 2013, when the great commodity price super cycle ended, MB began arguing that Australia faced a "lost decade" whereby living standards and disposable incomes would stagnate.
We argued that the economy would continue to grow at a solid pace on the back of historically strong immigration (population growth), but that per capita growth and living standards would flatline as the growing economic pie is divided among more people. We described a 'Ponzi' or 'rat wheel' economy that continued to grow on people power, but stood still on a per person basis.
Over the next seven years, we documented the "lost decade" theme regularly, which ultimately proved to be correct.
The below charts plot the Australian economy up to December 2019 before the coronavirus pandemic hit.
Real GDP per capita growth continued to it's long demise in the decade leading up to the pandemic, hitting levels not seen since the early 1980s recession:
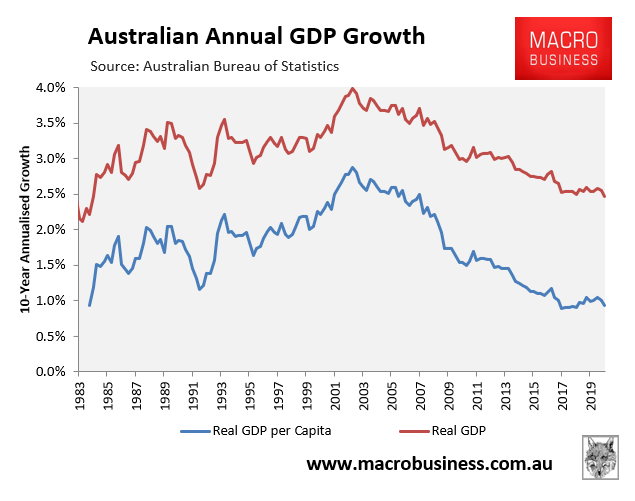
The gap between headline GDP and per capita GDP growth also widened, reflecting the rapid increase in immigration from the mid-2000s:

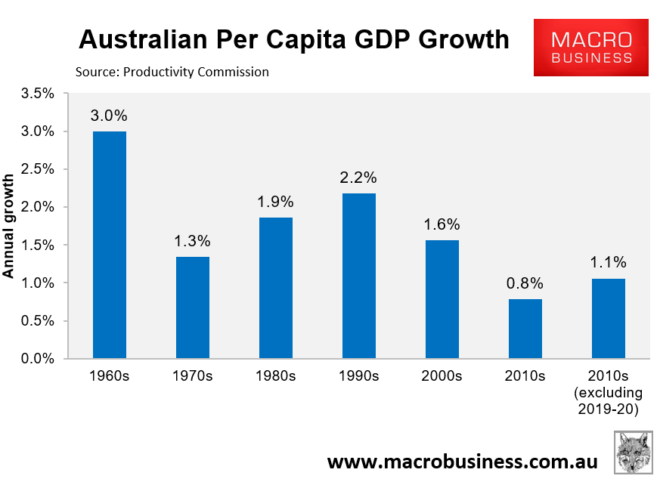
In fact, the Productivity Commission ranked the 2010s as the worst decade for per capita GDP growth in 60 years of data, even excluding the impacts of the 2019-20 COVID recession:
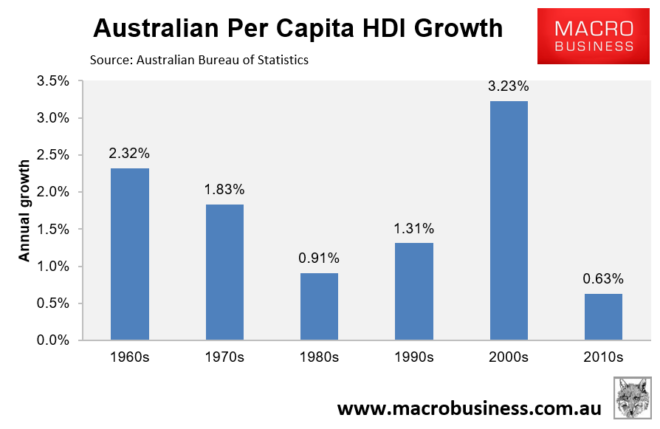
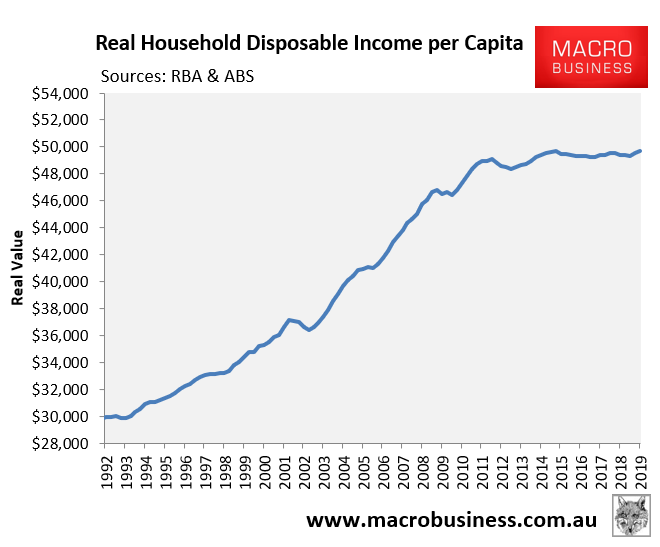
It is a similar story for real per capita household disposable income (HDI), with the 2010s recording the weakest decade of growth in data dating back to the 1960s:
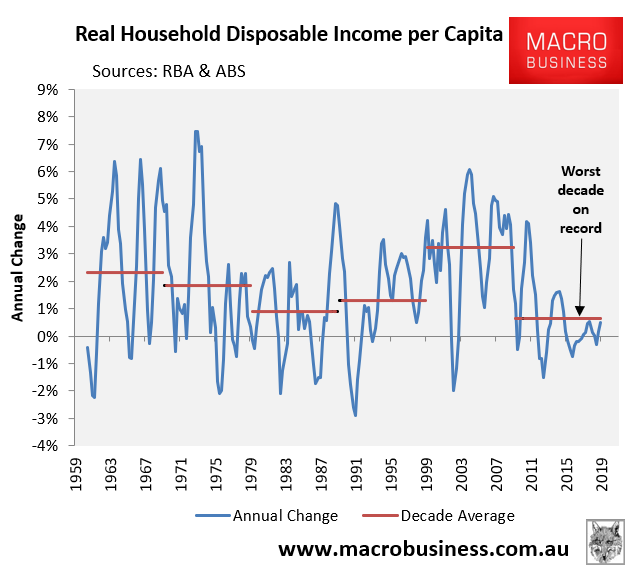
The next chart plots the same data in decade average terms and shows just how poor real per capita HDI growth was over the 2010s:
Moreover, all the growth in real per capita HDI was front-loaded in the first two years amid the blow-off in commodity prices and the terms-of-trade. After the commodity boom ended, Australia experienced effectively zero growth in per capita HDI between late 2012 and December 2019:
The latest Household Income and Labour Dynamics Australia (HILDA) survey is even more depressing, with almost zero growth in median household disposable income between 2008 and 2019:
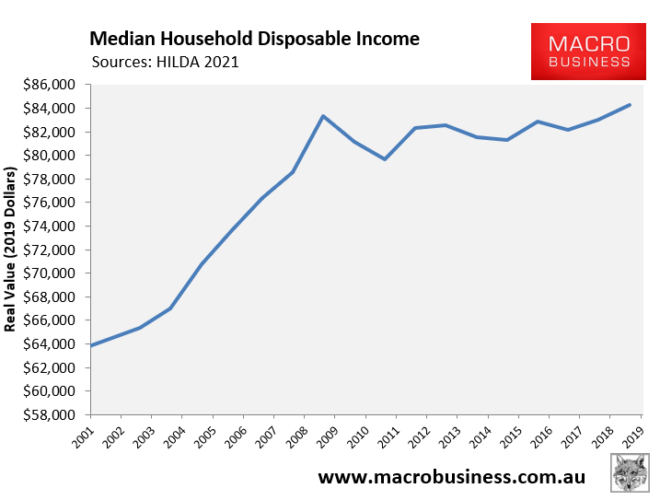
Hence, the "lost decade" theme coined by MB, which ended up being true.
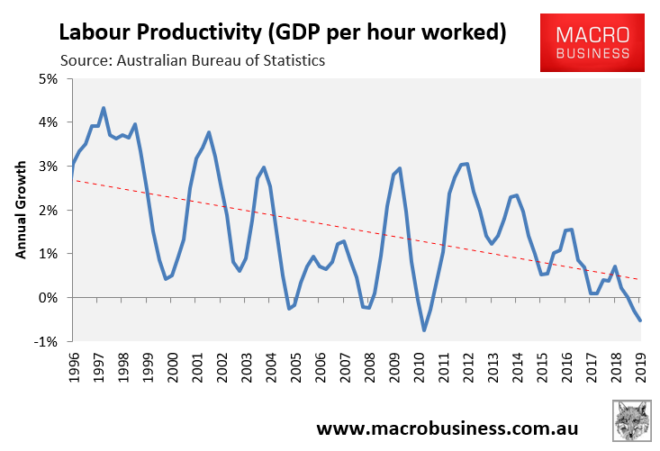
The underlying driver of the worsening per capita outcomes was the collapse in Australia's productivity growth. Australian households are further in debt, less globally competitive, and Australia is a less attractive investment destination – featuring amongst the world’s most expensive land and houses, energy, and internet.
As shown in the next chart, labour productivity - as measured by GDP per hour worked - trended down sharply over the 24 years leading up to the pandemic:
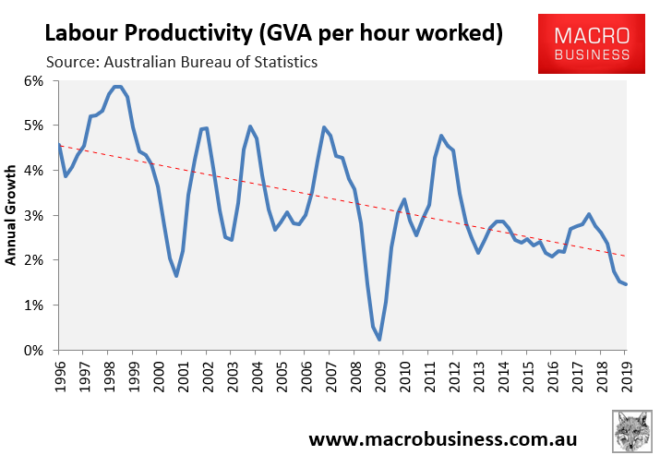
Gross Value Added (GVA) per hour worked in the market sector - another measure of labour productivity - also trended down over the same period:
'Big Australia' rebooted:
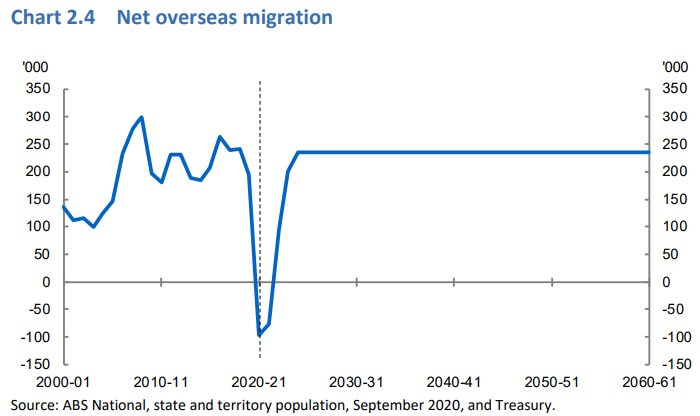
Last month, the Morrison Government announced that Australia will re-open its international border to overseas students, skilled visa holders and working holiday makers, with Home Affairs Minister Karen Andrews expecting that at least 200,000 migrant workers will arrive in Australia by July 2022:
"We are working on a figure of 200,000, it may well be more than that but we will be actively looking to bring as many people into Australia as soon as we possibly can" - Karen Andrews, 22 November 2021.
This announcement effectively brought forward the Intergenerational Report’s (IGR) projection of 235,000 annual net overseas migrants from 2025-26 onwards:
The various business lobbies and universities hailed the decision, with Restaurant & Catering CEO Wes Lambert stating “this is the biggest early Christmas present the hospitality industry has ever received”.
It is easy to see why the business lobbies are excited about the immigration reboot, since the primary driver of the Australian labour market's tightness is the loss of around 500,000 non-resident temporary migrants since the pandemic began:

We see strong parallels to 2012 when commodity prices and the terms-of-trade collapsed and immigration remained turbo charged. This ushered the 2010 'lost decade' described above, which Australia looks set to repeat from 2023 after the pandemic pent-up demand and stimulus wanes.
As Treasury explained in the latest IGR, there are three principle ways that the economy grows:
- Via productivity growth;
- Via increased labour market participation; and
- Via population growth.
These three drivers are known a the "Three Ps".
Of the three P's, boosting productivity is by far the most important driver of rising living standards over the long-term, since it allows more goods/services to be produced (consumed) from the same amount of effort.
Raising labour force participation can also raise living standards. However, working more hours (increasing participation) can mean that less time is available for other pursuits, such as relaxing or meeting-up with friends. So while working more will, other things equal, raise incomes and GDP, it can also take away from the other pleasures in life, reducing its benefit.
By contrast, population growth's impact on living standards is highly questionable. While it certainly does raise headline GDP (more inputs equals more outputs), there is strong evidence to suggest that it does not raise the incomes of existing residents, while also placing greater pressure on the environment, pre-existing infrastructure and housing, Australia's fixed endowment of mineral resources, and overall livability.
Therein lies the key problem with the "population" P in Treasury's framework - it is only concerned with headline growth (not growth per capita) and does not take into consideration costs. This dynamic is at the core of the ‘Population Ponzi’ MacroBusiness has referred to for a decade.
Two of the Three-Ps are stillborn:
The first "P" of productivity growth has become lacklustre, as illustrated above, with no signs that it will turn around given current policies.
The second "P" of participation is also hitting its limits. Australia's employment to population ratio and labour force participation rate has trended up over recent years and has hit an all-time high:
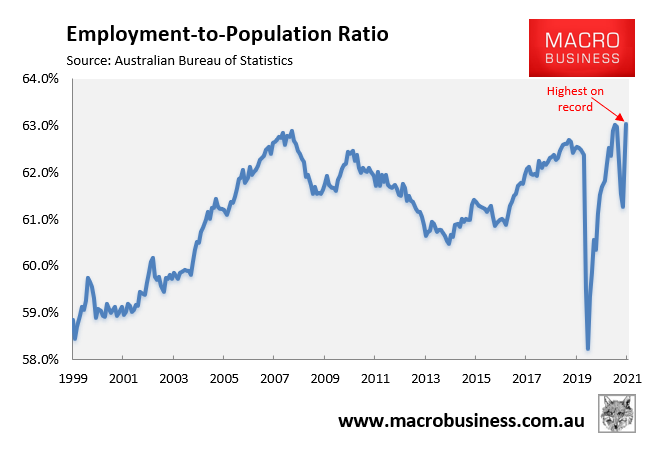
Thus, we are unlikely to see much uplift in participation from here.
Therefore, this will again leave population growth (read immigration) as the likely solitary driver of the Australian economy over the 2020s, which will mean per capita outcomes will once again flounder.
High immigration wrecks productivity:
There are good reasons to believe that running a mass immigration model also erodes the first and most important "P" of productivity. This happens through a variety of channels.
First, the massive rise in population growth creates chronic infrastructure bottlenecks across capital cities, driving up congestion costs.
The infrastructure investment required to keep pace with population growth is much more expensive than in the past, due to diseconomies of scale (e.g. tunnelling and land buy-backs). This means that every additional unit of infrastructure increases average costs across the economy, acting as a productivity drain.
Second, while migrants typically have high levels of labour force participation (thereby increasing the second "P"), the migrants that Australia imports are typically less productive, as evidenced by them earning lower than median wages and suffering higher unemployment than the general population.
Third, the increased labour supply and downward pressure on wages caused by mass immigration necessarily disincentivises employers from investing in labour-saving technologies and automation to lift productivity (see here and here). After all, why invest in these productivity enhancements when you can instead bring in low cost workers to do the task?
There are also broader macroeconomic arguments suggesting that strong immigration suppressed Australia's productivity growth, mainly by diverting resources (eg, capital and labour) from the tradable to non-tradable sectors.
Australia has held the pillow over its globally exposed manufacturing and replaced its employment with careers in a never ending housing construction sector that never provides enough homes for Australian housing to become cheaper for Australians. Australia has also turned its once well respected university sector into a casualised conduit for more immigrants, who are prepared to pay top dollar for degrees primarily because they enable migration to Australia.
Tradable goods and services are those that can be sold at locations other than at the place of production (i.e. can be exported overseas). Non-tradable products are those than can only be sold at the place of production (eg, coffees, personal training and haircuts). Tradable firms are typically more productive than other businesses because they benefit from economies of scale and must be competitive against firms both nationally and internationally.
Thus, the diversion of resources resulting from mass immigration encourages growth in low productivity 'people-servicing' industries, alongside diverting the nation's productive effort into houses and infrastructure.
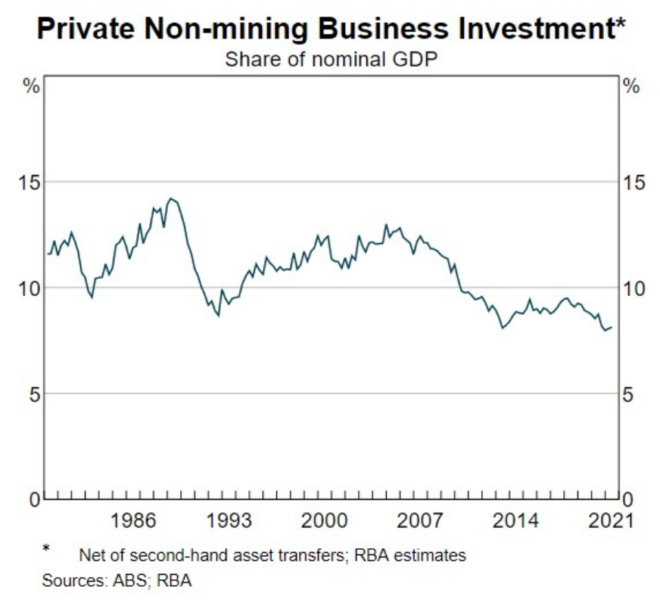
Australia's economic performance over the pre-pandemic years are consistent with this argument given the fall in both productivity and non-mining business investment as the Australian economy because increasingly concentrated on 'people servicing'.
Australia is also unique in that it pays its way in the world mostly by selling its fixed endowment of minerals. Thus, importing a bigger population via immigration necessarily also means this mineral wealth must be spread among more people, resulting in lower wealth per capita (other things equal).
In short, the planned reboot of the 'Big Australia' mass immigration model is very likely to achieve exactly the same result as last decade: sluggish productivity and per capita GDP growth, low wage/income growth, and overall falling livability as both housing and infrastructure are crush-loaded.
It is a recipe to enrich those that have already hoarded assets and capital, namely the already entrenched, wealthy and corporate interests such as big business, the property industry, and the education-migration industry.
Sadly, those are also the groups that pull our policy makers' strings.
By focusing entirely on the "P" of population growth, the Morrison Government has effectively killed the economic recovery for Australians and sowed the seeds of another lost decade.
The big question is whether Labor will break the immigration duopoly and set lower levels of migration if it wins government? We'll believe it when we see it.
History repeats for commodity prices
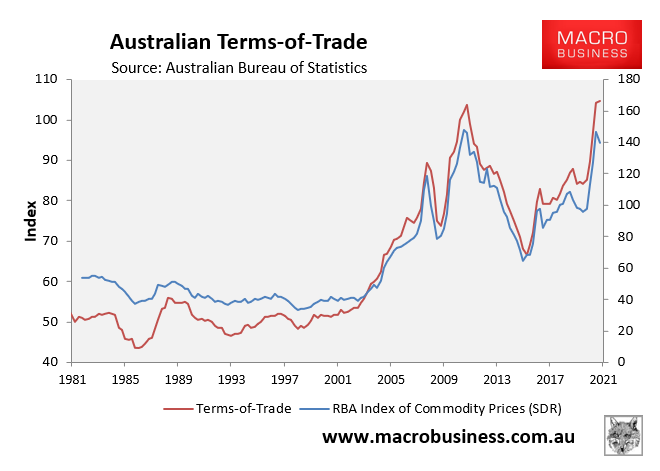
Another emerging parallel with Australia’s pre-COVID lost decade is the probability that falling commodity prices will add to the pain.
After 2011, China embarked upon the first of its ill-fated attempts to shift its growth model away from excessive investment and unproductive debt accumulated most obviously in its urbanisation process.
Although China ultimately failed in 2012, 2015 and 2018 in this reform course, its attempts were still enough to crash bulk commodity prices through much of the decade. This added materially to the income challenges emanating from the mass immigration growth model.
After COVID, China has embarked on the same reform course with greater purpose. The now hostile external environment has added strategic urgency to China weaning itself off global commodity supply chains, as well as driving independence in technology and economic greening.
Ahead, the odds favour a much more determined Beijing in its restructuring efforts, especially away from construction, as we see today in the unprecedented Evergrande bankruptcy.
Thus, the outlook for Australia’s steel input raw materials is terrible both short and long term and a rerun the lost decade’s external income shock is baked in.
What it means for asset allocation:
It has been eleven long years since the RBA last lifted the cash rate to 4.75%, after which it has all been downhill:

The primary driver of the falling cash rate is the collapse in wage and household income growth, which continually undershot the RBA's targets, in turn suppressing inflation.

This low wage growth, in turn, was driven by persistent 'slack' in the Australian labour market caused primarily by the strong immigration program, which added 180,000-plus workers to the Australian economy each and every year in the decade leading up to COVID.
The implication is that immigration and wage growth now holds the key to whether inflation will overshoot and force the RBA to lift rates. The RBA itself has stated repeatedly that it needs to see wage growth with a '3' in front of it for inflation to hit its target.
If immigration remains low, the labour market will continue to tighten, putting upward pressure on wages and inflation. In this scenario, the RBA would be forced to lift interest rates sooner, which would have negative impacts on asset markets (property in particular).
By contrast, if the federal government achieves its goal of quickly rebooting immigration to pre-COVID levels, then slack will return to Australia's labour market, reducing wage growth and inflation, and allowing the RBA to keep the cash rate 'lower for longer'.
With all sides of politics seemingly hell bent on returning to pre-COVID immigration levels (or higher) as quickly as possible, we foresee a situation whereby wage growth and inflation again undershoots expectations, leading to the RBA delaying interest rate rises. If this happens, then property price growth will again surprise on the upside.
That said, after soaring more than 20% this year, property prices are already losing momentum. And we expect property price growth to slow to between 4% and 7% nationally in 2022, with the smaller capitals and regions leading the way.
The same rationale applies to stocks and the Australian dollar. The lost decade sank the AUD and a repeat of the same policies will do again. The ASX also materially underperformed other developed market equities through much of the period and will repeat it. It is a little understood feature of the immigration economy that it is profits which are challenged as investment diminishes and capital shallows.
This will be made even worse by monetary policy sinking to the zero bound which structurally challenges bank margins, one of the few narrow winners of the immigration economy last cycle.
Conclusion:
All signs are currently pointing to a strong 2022 for the Australian economy.
Lockdowns have ended, households are awash with savings, there is a massive pipeline of construction, and there are plentiful jobs.
The big unknown is whether the new Omicron or other COVID strains will cause significant further restrictions and border closures, as we are currently witnessing in Europe. But hopefully Australia's high vaccination rate and isolation will prevent such occurrences.
The bigger concern is what happens to the economy after the stimulus-induced savings and construction have washed through? Australia's growth last decade was driven primarily by immigration-driven population growth, which caused individual living standards to flounder and caused Australia's own "lost decade".
We fear Australia will repeat the same mistake again as it returns to the pre-COVID mass immigration model.
Policy makers should have used the COVID pandemic to reset the Australian economy. Instead, they seem to want to double down on the very policies that failed in the past.
Leith van Onselen is Chief Economist at Nucleus Wealth.
The information on this blog contains general information and does not take into account your personal objectives, financial situation or needs. Past performance is not an indication of future performance. Nucleus Wealth Management is a Corporate Authorised Representative of Nucleus Advice Pty Ltd - AFSL 515796.


