May 2026 Performance Report

In May, global stock markets continued to march higher. The key question remains whether US profit growth (~20% forecast for each of the next two years) will remain incredible or become non-credible in the face of rising energy costs. Rising inflation and interest rates are a key concern.
The Iran war is dominating headlines and asset allocation. The worst-case scenarios would be devastating for stock markets. But, given the strength of current earnings, any semi-reasonable resolution (or even an uneasy detente) will be positive for stock markets.
Navigating the Tech Capex Boom, Geopolitical Shift, and EOFY Tax Strategy
The global investment landscape in mid-2026 is presenting a paradox. In the United States, equity markets continue to touch all-time highs, propelled by an insatiable appetite for artificial intelligence and chipmakers. In Australia, investors are grappling with post-budget fallout, changes to capital gains tax, entrenched inflation and a set of companies not well positioned for the growth that is driving the US market.
How do you reconcile these high-altitude valuations with shifting tax rules, inflation, and geopolitical noise?
To navigate this environment, you need to cut through the sensational headlines and look at the structural mechanics of the market. Let’s break down the three forces shaping your wealth today: the semiconductor cycle, the impending liquidity drain of mega-IPOs, and how to structure your assets to minimize the tax bite.
1. The Semiconductor Capex Cycle: An "Earnings Bubble"?
US stock markets are hitting historic highs, and critics are warning of a repeat of the late-1990s tech bubble. But is it a true bubble, or is there a fundamental difference?
The current tech boom is primarily an earnings bubble, not a speculative fantasy. Unlike the dot-com era—where companies with zero revenue traded on hope—today’s chipmakers and tech giants are backing up their stock prices with massive, real-world profits.
Consider Micron, a poster child for cyclical tech companies. Micron’s shares have risen dramatically over the last five years, but its business operates like clockwork on a four-to-five-year cycle. Every few years, memory chipmakers experience severe oversupply, margins crash, and they post losses.
Memory Market Capex Cycle:
High Demand → Under-capacity & High Prices → All 3 Players Build Mega-Factories → Oversupply → Price Crash & Losses → No New Capex → Back to High Demand
There are only three dominant players in global memory: Samsung, SK Hynix, and Micron. When demand rises, one player decides to build a new factory to capture market share. Because a single modern factory can supply 5% of global demand, the other two players cannot afford to fall behind. They build their own mega-factories in response. This massive capital expenditure (capex) eventually floods the market with chips, driving prices down and triggering the next downturn.
Right now, we are in the upward phase of the cycle, driven by the rush to build AI data centers. Because these new factories take years to complete, the next supply glut is unlikely to hit until 2027 or 2028.
Furthermore, this tech spend is flowing into the broader economy. Tech giants like Microsoft, Google, and Amazon are redirecting their cash reserves away from simple share buybacks and into massive physical data centers. This capex stimulates the real economy through a multiplier effect: hiring construction workers, renting heavy machinery, and purchasing materials, which boosts economic activity.
2. Emerging Markets: The Index Identity Crisis
Many investors buy Emerging Markets funds, believing they are gaining exposure to growing local economies—like Indian middle-class consumption or Brazilian economic growth.
However, the Emerging Markets index has undergone a dramatic shift. Ten years ago, the index was dominated by Chinese internet giants and state-owned enterprises. Today, the dominant drivers are global hardware manufacturers like South Korea’s SK Hynix, Samsung, and Taiwan’s TSMC.
If you own Emerging Markets today, you do not hold a diversified bet on emerging consumer growth. Instead, you hold an exposure to global semiconductor cycles. SK Hynix, Samsung and TSMC are effectively developed-market tech stocks that happen to be listed in South Korea and Taiwan. If global hardware demand rolls over, your emerging markets portfolio will suffer, regardless of how well domestic businesses in New Delhi or São Paulo are performing.
3. The Megafloat Trap: The Next Liquidity Drain
A significant risk to the current bull market is not a sudden economic crash, but a gradual drain on market liquidity.
The volume of US initial public offerings has remained exceptionally low over the last five years. This has created pent-up demand. A wave of mega-listings is on the horizon, including SpaceX (mooted at a $1.75 trillion valuation), OpenAI, and Anthropic.
On day one, these companies will list with a very low float—typically only 5% to 7% of their total shares will be available to the public. This small supply, combined with index funds forced to buy the stocks and enthusiastic retail demand, is highly likely to drive prices up initially.
However, the real danger emerges 12 to 24 months post-listing. When employee and founder lock-up periods expire, early investors will begin selling down their stakes.
Historically, large low-float IPOs see the public share supply grow from 7% to over 50% within two years. For three private giants valued near trillions of dollars, the stock market will need to find $800 billion to $1 trillion in cash to absorb the shares being sold by founders and early venture capitalists.
IPO Liquidity Squeeze Timeline:
- Day 1 (5-7% Float): High demand & forced index buying pushes price up.
- Month 12-24 (50%+ Float): Lock-ups expire. Founders sell. Market might need to find $800B+ to buy.
- Result (Liquidity Drain): Capital pulled from existing stocks, pressuring the wider market.
This represents a massive liquidity drain. That cash must come from somewhere, meaning investors will likely sell other equities to fund these purchases. If corporate earnings begin to slow down at the same time this wave of supply hits, it could mark the end of the current market cycle.
4. Geopolitics and Oil: A Quiet Correction
While geopolitical conflicts in the Middle East dominate the news, the oil market is behaving in a surprisingly stable manner.
Alarmists frequently warn of a global energy crisis, but the supply-demand balance has quietened. Global demand stands at roughly 100 million barrels per day, while supply is around 96 million barrels, resulting in a temporary inventory draw.
Crucially, demand is shifting. Reports indicate that Chinese oil demand has fallen by approximately 10%. This is not due to a temporary slowdown, but a permanent structural change: the rapid adoption of electric vehicles, expanded public transport networks, and fewer international flights.
At the same time, oil tankers continue to navigate shipping routes, and pipelines carry fuel across borders. A minor 2% drop in global demand combined with a 2% rise in supply might be all it takes to bring the market back into equilibrium. The global economy has proven far more resilient to energy shocks than linear forecasts suggested, allowing markets to focus on technological productivity rather than inflation panic.
So, a potential major risk still. But potential market resolutions even without an all-encompassing peace agreement.
5. Inflation and Asset Allocation: The Seductive Trap of Cash
With interest rates higher, many investors are choosing to park their savings in term deposits yielding 5% or more. Cash feels safe, predictable, and low-risk.
But cash is a seductive trap. While nominal rates are high, inflation is quietly eroding your purchasing power. In Australia, the trimmed mean inflation rate (which measures underlying inflation) has risen, even as headline inflation fell due to temporary government subsidies like petrol excise cuts.
If you leave your money in cash during a period of sustained inflation, you are guaranteed to lose purchasing power.
Over a five-to-ten-year horizon, equities remain the most reliable asset class to outpace inflation. High-quality businesses can raise their prices in line with rising costs, preserving their margins and protecting your capital.
Furthermore, there is a powerful deflationary force building in the background: technological productivity. In the US, autonomous driving is scaling exponentially. Alphabet's Waymo has doubled its weekly trips from 250,000 to 500,000 in just six months. As driverless delivery and services expand, the cost of transporting goods will fall, providing a structural offset to global inflation.
6. Look Beyond the ASX
We are living in a K-shaped global economy.The Australian Dilemma: A Market of Rent Seekers
Let’s be honest about the structure of the Australian economy. It is highly dependent on two things: digging commodities out of the ground and selling houses to each other.
The US AI Earnings Boom: Real Cash, Real Growth
Contrast the Australian market with what is happening in the US.- Look Beyond Australia: The ASX is heavy with rent-seekers and light on genuine innovation. To capture the extraordinary earnings growth of the current decade, overweight international equities.
- Embrace the AI Value Chain: You don't have to buy the most expensive, hyped-up tech stocks. Look across the entire value chain—from the companies building the data centres, to the chip manufacturers, to the businesses leveraging AI to dramatically reduce their operating costs.
- Acknowledge the energy transition: Energy systems are changing. Countries no longer want to be dependent on a troubled Middle East or Russia (or a mecurial USA?). Battery and solar annual production has already grown exponentially. Existing energy is having its life extended.
- Protect Against Sticky Inflation: We are moving into an era of higher nominal interest rates and lower real interest rates. Central banks will tolerate slightly higher inflation because they cannot afford to completely crush their heavily indebted economies. Protect your defensive allocations by utilising inflation-linked bonds rather than relying solely on traditional fixed interest.
The Asymmetry of Hope
The problem? The distribution of outcomes is not a neat bell curve. It’s a cliff.- Upside: If a deal is struck, we are looking a markets that are a little expensive and extremely high earnings growth. A reasonable trade-off.
- Default course: We are in an interminable standoff of "almost" deals and extended deadlines. But, if enough ships get through, energy prices are high but not catastrophic, then there is a navigable path for stock markets.
- Downside: Extreme. At the other end of the spectrum lies $200+ oil and a deep, structural global recession as energy supply chains are physically smashed.
Net effect: Are we headed for the greatest corporate profit boom of our generation? Or a deep recession driven by rampaging energy prices.
Asset allocation
We have been winding back on our share exposure. We are overweight inflation linked bonds. At the end of the month, the growth in international meant our allocation to shares was high:

Performance Detail
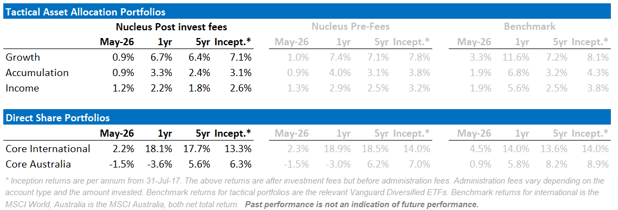
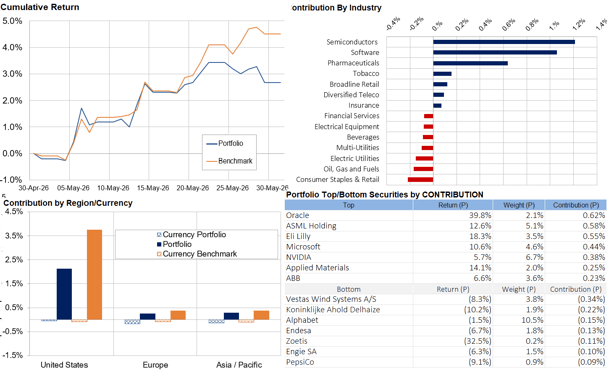
Core International Performance
Markets continued to rally over May despite no apparent resolution of the Iran Conflict. It was Risk-on with Tech, Software and Pharma continuing to rebound. Currency not a major factor this month.
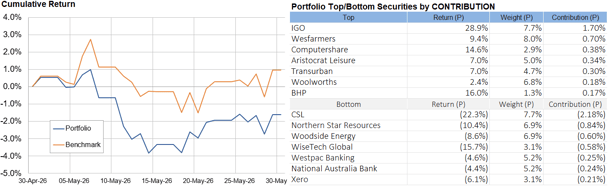
Core Australia Performance
Local stocks didn't mimic the global rally with CSL and Tech big decliners.