

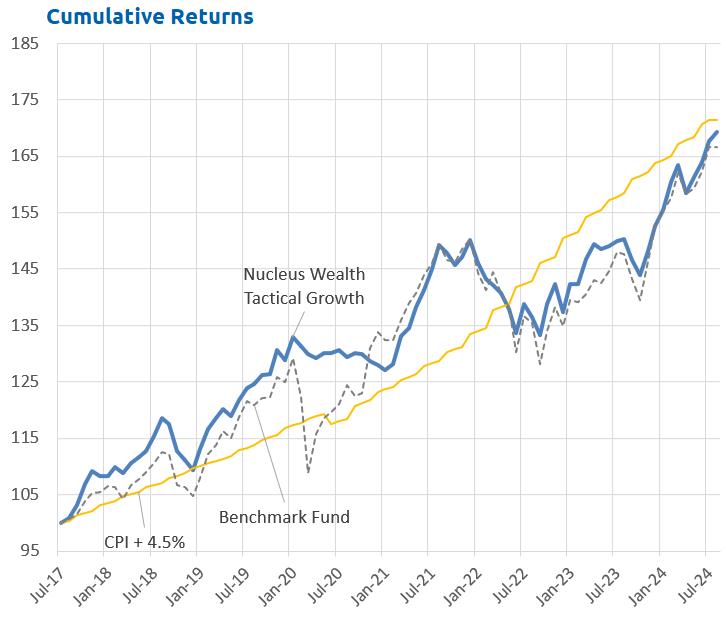
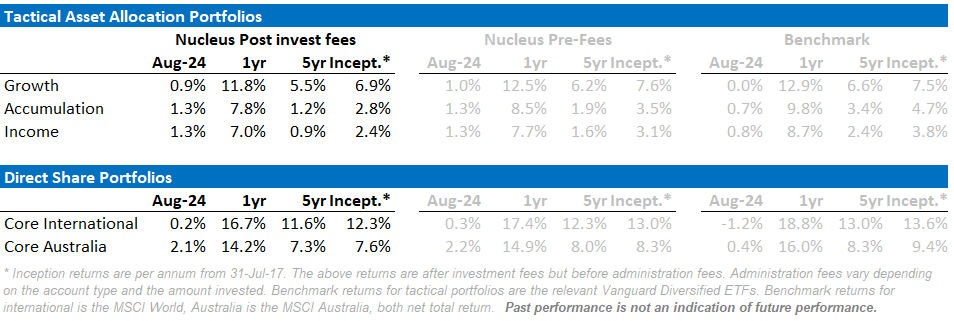
In August global markets added to their strong performance so far this year, however the rising AUD offset all of the gains. The Australian market finished up slightly. Our portfolios all outperformed their benchmarks. Our tactical portfolios outperformed as longer-term bonds rallied.
This month’s focus is on the flood of excess capital and its implications for modern financial markets. Importantly, I’m not commenting on short-term opportunities in the next week or month but on how you should position for the medium term.
The question is whether valuations should be structurally higher and interest rates structurally lower due to excess capital. Should investors wait for markets to revert to below-average valuations? Or will we never get there?
A historical perspective
Any market comparison is influenced by evolving reporting standards and capital structures. And economic statistics are arguably more prone to this effect than other time series.
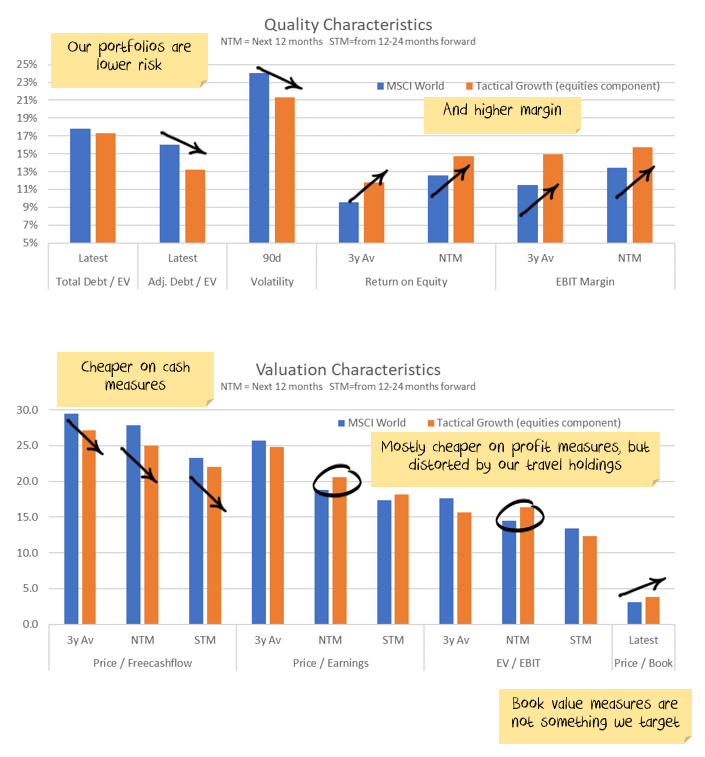
For example, the price-to-book value ratio has changed due to shifts in accounting norms over the past decades. Basically, a company’s book value used to be written up and written down. Now, the overwhelming emphasis is on writing it down. Comparing a time series of this ratio can be misleading.
The signs of excess capital
We live in a world of assets and liabilities. Debt, however, is not one-sided: a corresponding asset is created by taking out a loan. Which is why rising debt is a sign of increased capital:
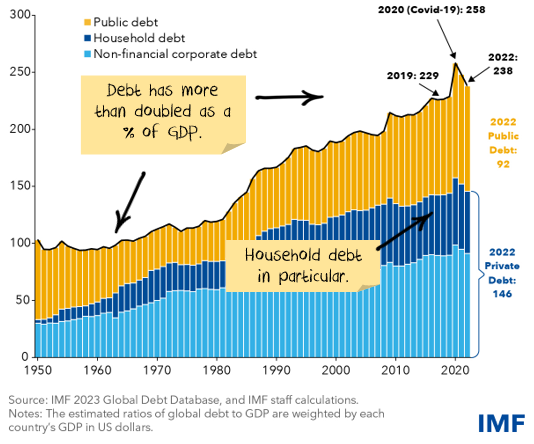
Global debt has risen from 100% of GDP to around 250% over 70 years. Private debt has also surged, with household debt now accounting for about 50% of GDP. While the line looks to be falling at the end, you can ignore that. The absolute level of debt is still rising; the improvement in the ratio is because the denominator, GDP, recovered post-pandemic. There is no break yet in the long-term rising trend.
Suppose we broaden the definition to financial assets, including stocks, bonds, and private equity. The growth is even more significant, from 300% of GDP in the 1950s to 600% today.
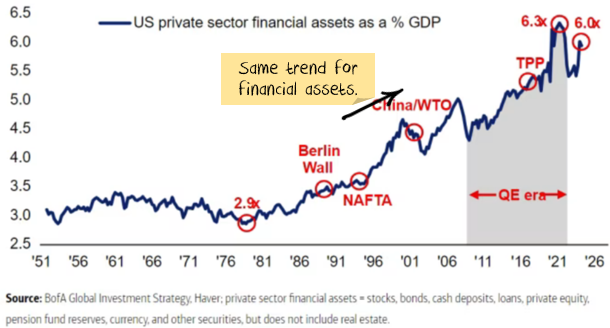
The ‘Buffet Ratio’ compares stock market valuations to GDP. Markets are six times higher than in the 1980s on that measure. Excess capital is everywhere.
Inequality is also important.
The simple version is that if you give a rich person an extra $1,000, they will invest it, while a poor person will spend it. The pandemic brought this to the fore. Government support programs for poorer people saw a surge in demand that fuelled consumption and eventually inflation.
But that has now reversed, and we are back to increasing inequality. This means more money for the rich, more investment, and more capital.
Return on capital. Long-term = critical, short-term = meh.
Over the long term, valuations fluctuate. What is important is the return on the capital invested. A 2% per annum higher return over 25 years means a 64% increase in returns over that period.
Wealthier countries generate more excess capital, often leading to higher stock valuations but potentially diminishing returns. Historically, stock markets offered 6-9% returns; with more capital pursuing the same opportunities, will these returns decrease over time?
But, in the short term, valuation multiples matter more than returns. Suppose the market goes from a 10% discount to a 10% premium over a year. In that case, a 2% difference in return is a rounding error vs the stock market return.
If there is too much capital chasing too few opportunities, valuations rise.
If the absolute dollar value of profits is still rising (largely yes), we can take it one step further.
Say the return on stock markets is expected to be 8%, comprised of a 3% yield and 5% growth in cashflows.
Say there is too much capital, and the return should be 7%. If profits don’t fall, then prices will need to rise until the future returns look like they will be 7% rather than 8%. Which is essentially what they have been doing:
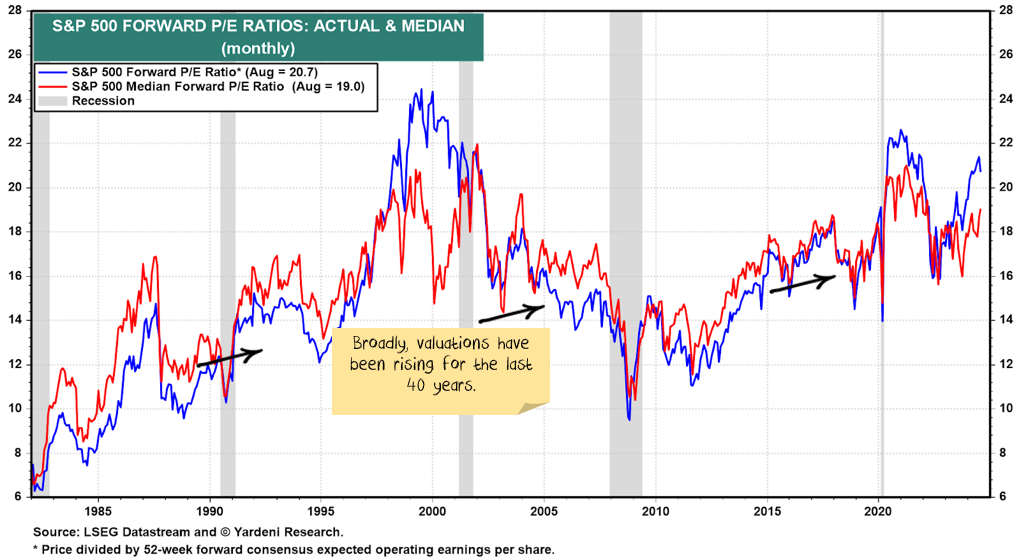
The irony is, if we expect lower future returns because of too much capital (and profits not falling), then we should be buying in front of the change as valuations rise.
Creative destruction is a vital variable.
What can go wrong with the above? One of the key assumptions is that profits accrue largely to existing companies.
Say we live in Destructalia, a country with lots of startups and creative destruction. Then, maybe the lower returns come because of a wave of new entrants funded by the excess capital compete away the incumbents’ profits. The new companies compete for staff, raising wages and shifting the value capture from capital to workers.
Compare that to Protectalia, say, a country with relatively weak antitrust, oligopolies, and captured regulators. Central banks rush to prevent bankruptcies at the slightest whiff of contagion. Then, existing companies can use regulation to protect profits. They can buy disruptors before they do any damage to margins, and the status quo is maintained.
I’ll argue we are more like the second than the first.
Technology
Technology also plays a role. Rapid increases in technology often concentrate wealth in the hands of a few. It shifts the power from workers to companies. It also leads to excess capital.
Central banks know the world has been financialised.
The Victor Schvets argument is that financialisation, where more money is funneled into financial markets, drives consumption and capital expenditure:
There is abundant capital and policy tools to smooth such ructions, and the highly financialised, highly indebted world we’ve created means it is in no one’s interest for bubbles to pop – not highly indebted governments, not highly indebted households, and not the central bankers and policymakers charged with ensuring stability.
Central banks are now caught needing to defend markets, as a dramatic drop in stock markets can now trigger a downward economic spiral. On the flip side there is the opportunity for an upward spiral of rising markets supporting economic growth.
The question is how to invest in that world.
Despite arguments for market overvaluation, there is still an argument for investment if capital influx continues. If:
- Inequality keeps rising
- Global debt keeps rising
- Technological changes mean companies capture more upside than workers
- Existing companies (with the help of regulators and politicians) keep most of the profits
Then you probably want to be carrying more equities in your portfolio, despite the higher valuations.
Asset allocation
After being very expensive for a number of years, stock markets briefly touched off average value before becoming expensive again. However, debt levels are extremely high. Earnings have been going backwards, and seem overly optimistic in 2024.
Markets are supported to a great degree by central banks and governments. Policy error is every investor’s number one risk.
But, any number of other factors could force this off course and see unexpected inflation. Energy prices could jump higher, increasing inflation. Chinese/developed world tensions might rise further, leading to more tariffs. Or, China might decide again to supercharge property investment.
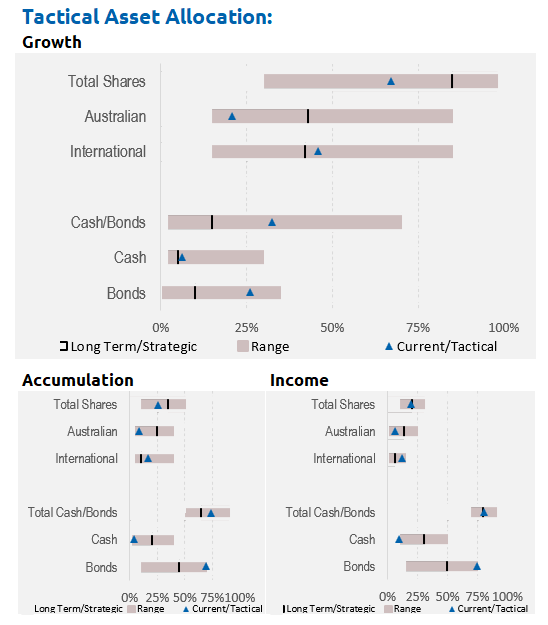
We are underweight Australian shares, and as noted above, overweight bonds, with the view that the Australian market is more affected by interest rates and less affected by an AI boom:
Performance Detail
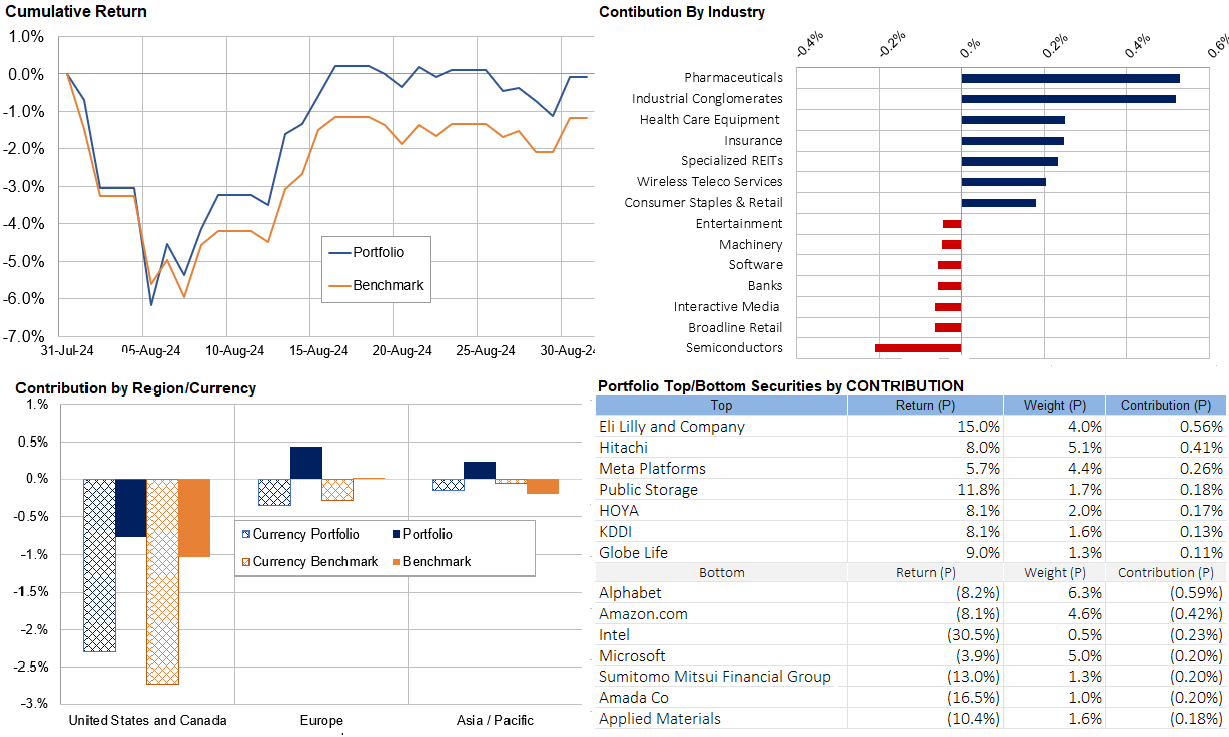
Core International Performance
August saw volatility persist but stocks recovered toward the end of the month, however, the Magnificent Seven were some of the worst performers. Regionally Europe and Asia outperformed yet again offsetting the US weakness and demonstrated the advantages of geographic diversification. Currency proved a drag as the AUD appreciated. Over the month we retained our exposures.
Core Australia Performance
Australian equities outperformed their benchmark and International for the third month in a row. Banks and growth stocks remain the main drivers with WiseTech having a stunning full year result.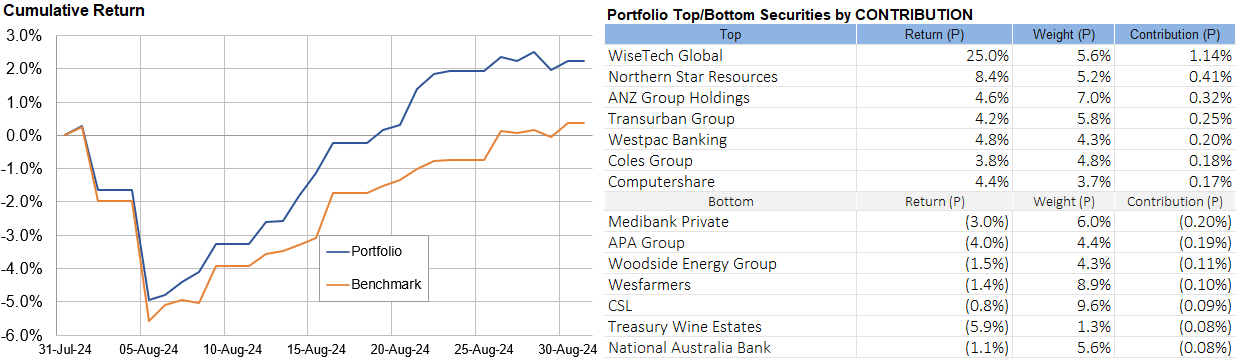
Portfolio Yields
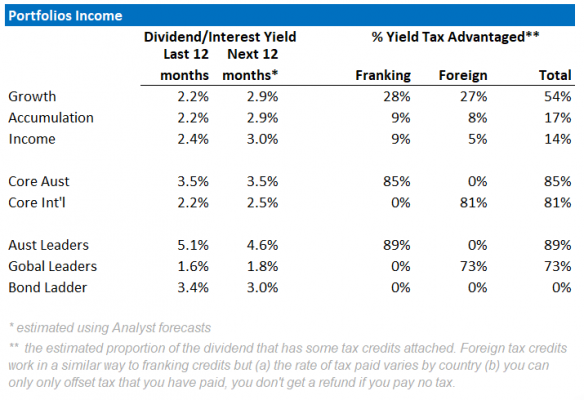
This table shows the income yields of our various portfolios, including their proportion of Franking and Foreign tax paid over the past 12 months.
We also include an estimate of forecast yield (next 12 months), assuming no change in current tactical allocations and stock composition. There is an element of rising yields, as global interest rates rise. Offsetting that however, is the possibility Australian equity yields may fall as commodity-driven mining companies have lower profits to pay out. Our underweight Resource position in Core Australia portfolio should help maintain its yield.