
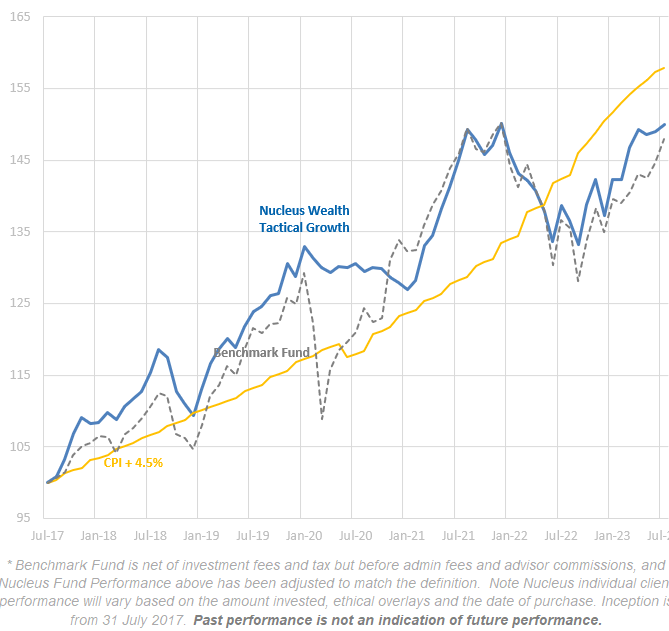
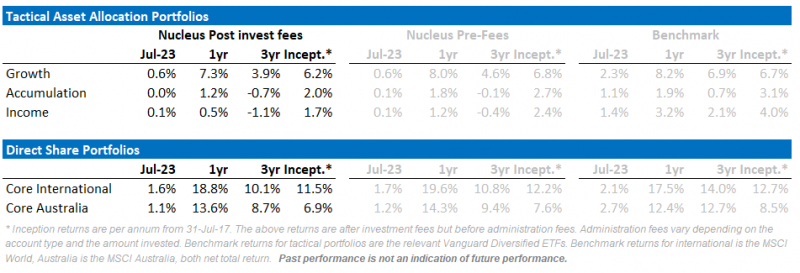
During the year to July, our Core Australian and Core International equity portfolios outperformed their benchmark, bolstered again by our defensive and underweight resources and bank stock exposures. That trend reversed in July though, as the most beaten-down stocks rallied. Our tactical portfolios underperformed as bonds pulled back this month, and performed in line with the market over the last year with considerably lower volatility than their benchmarks.
Looking forward, we expect weak stock markets as the central banks raise rates to slow demand, shrinking company profits.
With that in mind, the key factor to watch in the coming months to tell if we are wrong or right is the change in corporate profitability. The recent reporting season in the US showed some signs of weakening earnings, but not enough to confirm our thesis yet. Earnings forecasts have been drifting lower.
The snowball is getting bigger
Chinese property is the largest asset class in the world. What happens there matters. And the raft of poor economic data emanating from China has investors looking at least a little nervous.
Mathematically speaking, predicting an avalanche is difficult. Models are good at telling when snow builds up, and conditions are “ripe”. They are not good at predicting exactly when an avalanche will occur. That is how the Chinese construction boom has felt. For the last 15 years, China has built more than any country has ever built relative to the size of its economy. The conditions have been ripe for years. The question “Why now?” is critical.
Also, I want to highlight a nuance. There is a difference between property prices in China and property construction in China. A significant tumble in prices would almost certainly crash property construction. It doesn’t necessarily follow in the other direction. i.e. a rescue of property prices won’t necessarily rescue the amount of construction. Resource companies, particularly iron ore, rely heavily on property construction.
Property Developers
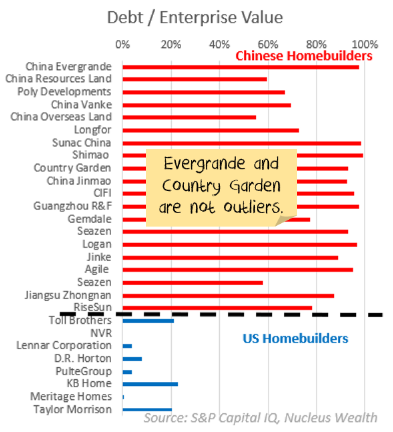
Country Garden has emerged as the next major Chinese developer to run into trouble. The important thing to note is that Evergrande and Country Garden are not “rogue operators”. They look a lot like any other developer.
There are, in effect, four big (known) balance sheet issues for the top 20 developers:
- Debt. For every $1 of (market) equity, the median Chinese developer has $9 of debt. For the top US developers? $0.07.
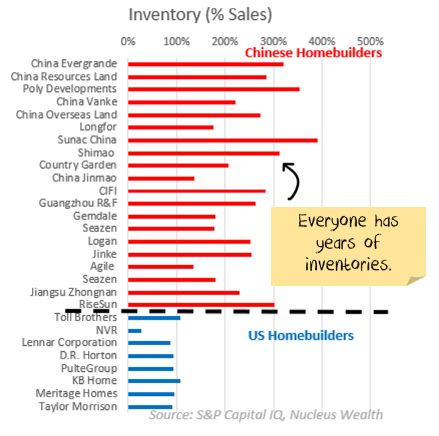
- Inventories. At current rates of sales, the median developer has more than 2.5 years of inventories.
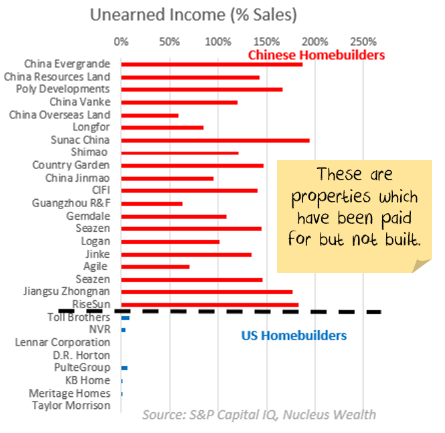
- Prepayments/Unearned income. In China, customers typically pay 100% of the value of a house before it is built. Based on sales volumes, the median Chinese developers will need to build for the next year and a half just to complete the properties already paid for.
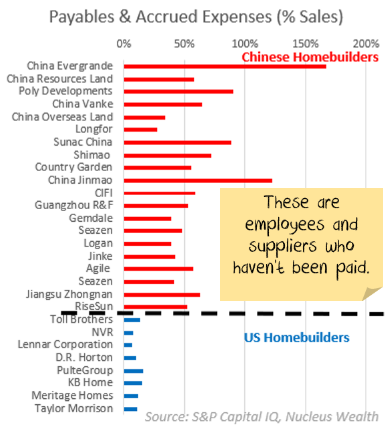
- Payables and accrued expenses. Chinese developers are about six months late on paying suppliers and employees.
Then, we have the unknowns. There is absolutely more debt in the form of off-balance-sheet liabilities. This is not just a China thing. Every property boom has a range of hidden debts or guarantees. When property prices stop rising, these emerge. How big? It is anyone’s guess. I would say, best case, add 25% to the debt figures. More likely 50-100%.
In summary, there is debt. Then more debt. And some debt on the side. Anyone who could possibly be owed, is owed. The issue is that if you were a Chinese developer without six layers of leverage, you underperformed in the boom years. And so natural selection got rid of you years ago.
How does this resolve itself? In my view, the property developers are now state-owned entities. Maybe not in name, but in practice. The government will feed them enough debt to stay alive. Their job? Finish the paid-for properties and then go broke. But this process won’t be quick.
Macro construction statistics
Let me start with the big problem. The numbers don’t add up. The trend is probably instructive, but the absolute levels are wrong.
Take floor space under construction. This should equal last year’s number plus any new starts minus completions. i.e. if Starts > Completions, then this number should be rising. It is falling. There are billions of square meters missing.
Assuming that the floor space under construction and completion stats are correct, we can calculate the implied net starts. They are much, much lower than the official starts:
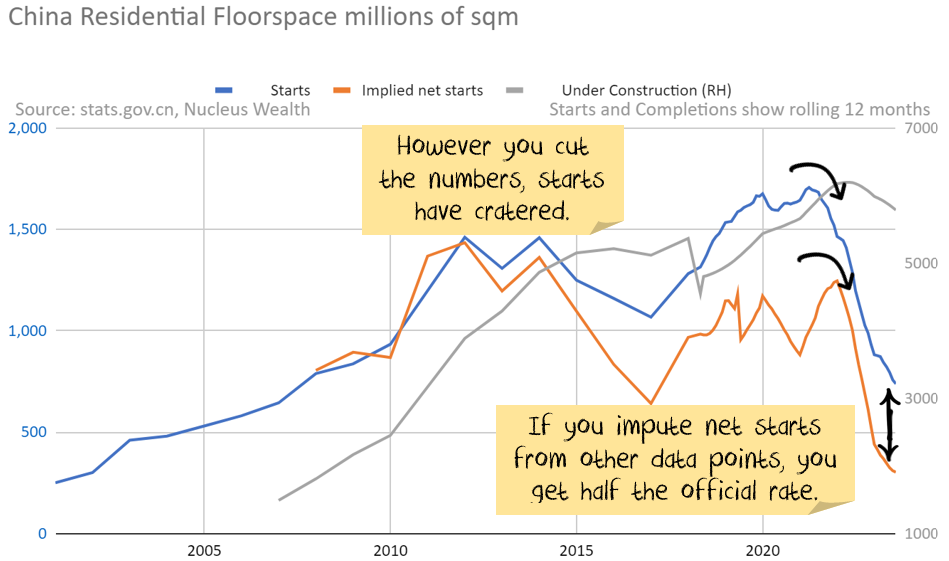
If the floor space under construction is correct, it will take almost nine years to complete. Now China is accused of lots of faults in their property construction. But building slower than in Western countries is not one of those faults. It is more likely that much of the floor space under construction will never be made.
It used to be that land sales provided some forward indication. But China stopped publishing those statistics earlier this year. The last set of numbers point to a relatively dire outcome.
Regardless of the level, there is probably some information in the statistic that starts have fallen 75% vs prior years. Completions have not yet fallen, which might suggest that the amount of building level is still occurring, so steel use is holding up. But, if Chinese developers are now “state-owned utilities”, you would expect those numbers to trail off.
More than a third of all global steel goes into the Chinese construction sector. About half of that goes into Chinese infrastructure.
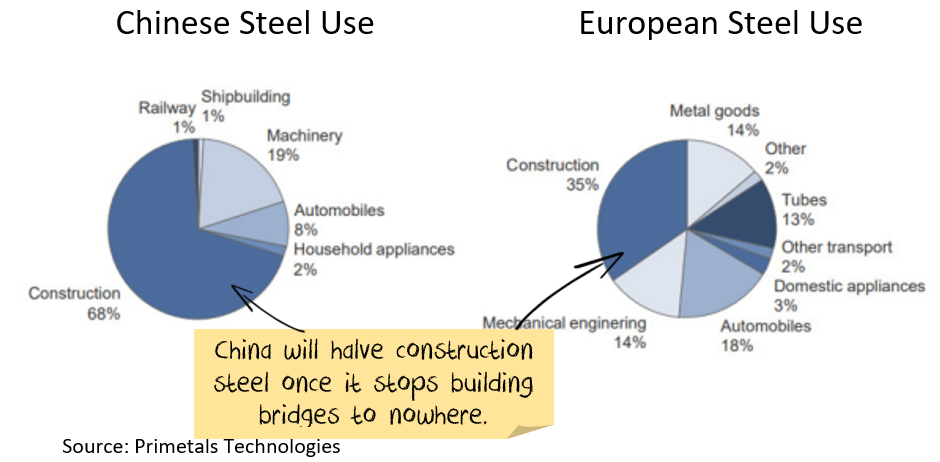
Could global steel use fall by 10%, just on the back of Chinese property construction normalising? Sure.
Can infrastructure make up the difference?
The global average is to spend a little more than 5% of GDP on infrastructure. China spends about four times that amount and has done so for two decades. China has already ramped up infrastructure spending this year. It is expected to be around 10% higher in 2023 after a record-breaking 2022. In recorded history, never has a country spent so much on infrastructure.
Take Guizhou, a poor Chinese province with per capita GDP well below USD10,000. It has a significant debt problem and the world’s tallest bridge. Actually, it has 23 of the world’s 100 highest bridges and more being built:
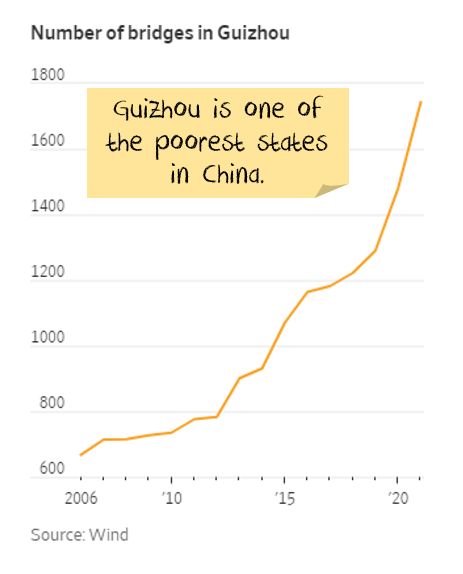
Can China spend more on infrastructure? Sure. But not enough to make up for the falling property effect. And not productive infrastructure. All the productive projects were built years ago.
The bigger risk is that Chinese infrastructure spending pivots from building underutilised bridges, railways and airports to funding things like semiconductor research. Commodity consumption would crater.
Shadow banking risks
Most of the shadow banking sector in China lends to property and local government construction. Given all the problems, one of the major lenders, Zhongzhi, recently missed payments on high-yield investment products. The shockwaves are rippling.
If China were a market economy, given the extreme levels of debt and overbuilding, I would equate Zhongzhi with the early stages of the financial crisis, where CDO funds were starting to fail.
There are vicious feedback loops that failures in this sector could spark. Investment trusts default, property developers lose funding and have to declare bankruptcy. Millions of Chinese lose savings and sharply curtail spending. Property values tumble, banks are insolvent. GFC 2.0.
The expectation is that Chinese authorities would step in before that. And they probably will. But it is a dangerous cliff to be dancing near.
Consumers to the rescue?
The hope earlier this year was that the Chinese consumer would boost spending and save the economy. It is not happening.
Partly this is because consumers did not receive the same support that Western consumers did during COVID and did not have the same excess savings. And there are probably “animal spirits” involved. The message to Western consumers was “the government will financially support you if things go wrong”, suggesting that they don’t need as much savings. The message to Chinese consumers was, “the government will not support you, and you will need to rely on your own resources”. So, it is no surprise Chinese consumers want to avoid splurging.
President Xi is on the record with a fundamental dislike for giving consumers hand-outs. And a fundamental preference for giving companies hand-outs. There is little to suggest that this is changing.
On top of that, China has deflation, which encourages consumers to delay spending.
Then we get to demographics. China’s birth rate has crashed from already low levels. The number of workers in the economy is now falling. Both a very negative indicators for consumption.
Finally, China has an extremely high level of youth unemployment. So much so that China has stopped publishing statistics. Suffice to say that youth unemployment is well over 20% and potentially much, much higher. This is the next generation of consumers, typically some of the biggest spenders, are struggling to find work.
Indications are that many of the unemployed have university degrees and are struggling to find jobs commensurate with their degree. This is yet another sign that China is falling into the middle-income trap. i.e. China is failing to progress from a manufacturing and building-led economy.
Financial repression cannot be both the cause and the cure.
China grew because of financial repression. It kept household incomes low and forced the money into investment. This worked well while productivity was rising. But productivity peaked a decade ago.
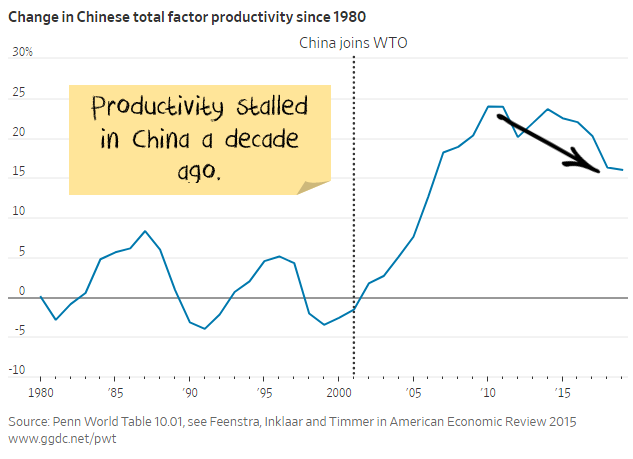
To mask the problem, China has turned to debt markets. Effectively, rather than solving the financial repression, China has chosen to hide the pain behind a growing debt burden.
For sustainable growth, China needs to increase the household sector’s share of national income and stop financial repression.
But all the measures China is putting in place have the opposite effect!
A falling currency makes imports more expensive and exports cheaper. Bad for households, good for corporates.
Lower interest rates punish savers (mainly households) and benefit borrowers (mainly corporates).
Where to now for China?
Economic statistics have turned nasty. There is a real risk of a significant decline. This is a political economy as well as a real economy problem. The government doesn’t want to give to consumers; consumers don’t want to spend. The infrastructure card has already been played.
The assumption is that the government will bail the property sector out. It is too big to fail. It is also, in some ways, too big to save. The way I see the scenarios playing out are:
- Bull case: returning to the old days of construction. This is possible, but very unlikely. In my estimate, this would require the biggest stimulus of all time. From a country already spending more on construction than any country ever has.
- Base case: “quite a lot” of stimulus to avoid disaster. Keep developers alive to finish housing projects, extend and pretend. Bundle bad debts into state-owned entities. Do enough to prevent a replay of the financial crisis. End up looking like a worse version of Japan after its construction boom.
- Bear case: stimulus is either not large enough or not fast enough. This option is increasing in probability. Could we see defaults that spiral? Could property price falls become chronic? Could we see a balance sheet recession? A replay of the financial crisis (albeit with fewer links to the rest of the world)? Absolutely.
China is up to its fourth attempt to wean itself off its property construction addiction. They lost their nerve on three prior occasions. But the cost is getting higher each time. Each bailout has required more and more debt. Reversing the process this time is going to be expensive.
If China waits too long or doesn’t do enough, the snowball might become too large to stop. To date, China looks unwilling to pay the price. If it waits too long, it might be unable to pay the price.
Investment Outlook
I have some pretty clear ideas about which trends are sustainable and which ones aren’t in the long term. However, the short-term is far less clear:
- The banking crisis is morphing into a credit crunch. This is the number one US issue over the next few months.
- The sanctions on Russia are unlikely to be lifted anytime soon. The short-term effect was commodity shortages. In the longer term, it seems likely that we will see a re-orientation, Russia will supply more to countries like China and India, less to Europe. For some commodities (oil, wheat) this will be easier. For others (gas) it will be extremely difficult.
- The geopolitical energy crisis in Europe has eased on the back of much warmer weather. Australian energy price caps have pushed down energy prices. There will be a rush to alternative energy sources in the mid-term.
- Supply chains continue to improve.
- Governments continue to withdraw (or not replace) stimulus. There will be a fiscal shock into 2023. The question is whether the private economy will be strong enough to withstand it. Leading indicators suggest profits will be lower.
- Central banks have made it clear that they will try to solve the Russian-induced energy issues and supply chain-induced inflation by raising interest rates. The odds of a policy error have increased significantly.
- China still has not bailed out the property sector. Changes so far are not a bailout… but they may morph into one. China is trying to ensure that houses under construction get built, small businesses have access to credit, infrastructure building continues, and failing developers do not crash the economy. China is yet to show any signs of turning back to the old days of debt-driven property developer excesses. If China doesn’t continue to roll out new measures, the commodity market will deflate again.
It is still not the time for intransigence. Events are still moving quickly. But we have positioned the portfolio towards the most likely outcome and are gradually increasing the weights as more data arrives.
Bond yields have risen significantly. If the world heads for a recession this is a buying opportunity. In the short term the narrative “high inflation, central banks raising rates = sell bonds” seems to be coming to an end. Although there may be another last hurrah as the US central bank looks to rein in the stock market optimism.
The mix of higher volatility, leading to deleveraging of risk parity trades and momentum means yields could yet go higher. We are invested for bond yields to reverse.
Asset allocation
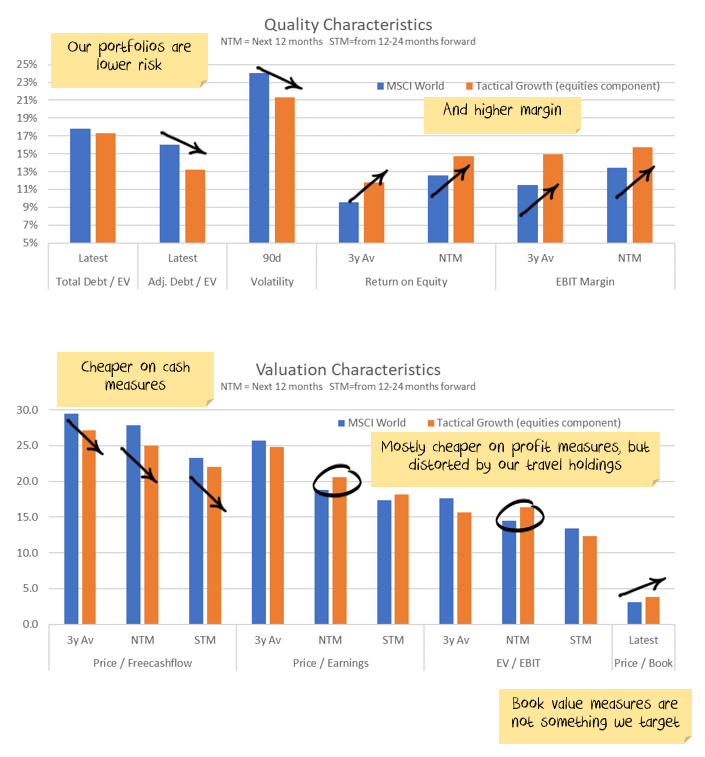
After being very expensive for a number of years, stock markets are now merely expensive, in 85th percentile by value. Debt levels are extremely high. Earnings growth had been really strong but has come to a halt. There are signs it is starting to reverse.
Markets are supported to a great degree by central banks and governments. Policy error is every investor’s number one risk.
But, any number of other factors could force this off course and see unexpected inflation. Energy prices could jump higher, increasing inflation. Chinese/developed world tensions might rise further, leading to more tariffs. Or, China might decide again to supercharge property investment.
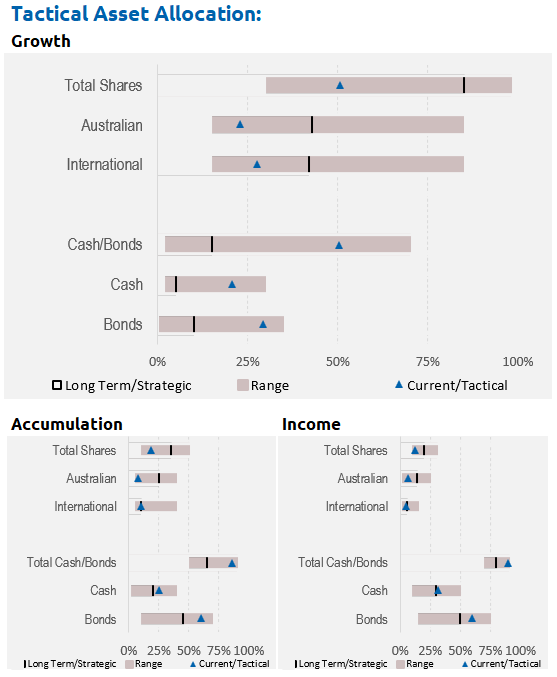
We are significantly underweight Australian shares, and as noted above, overweight bonds, with the view that the Australian market is more quickly affected by rising interest rates and more affected by a global recession:
Performance Detail
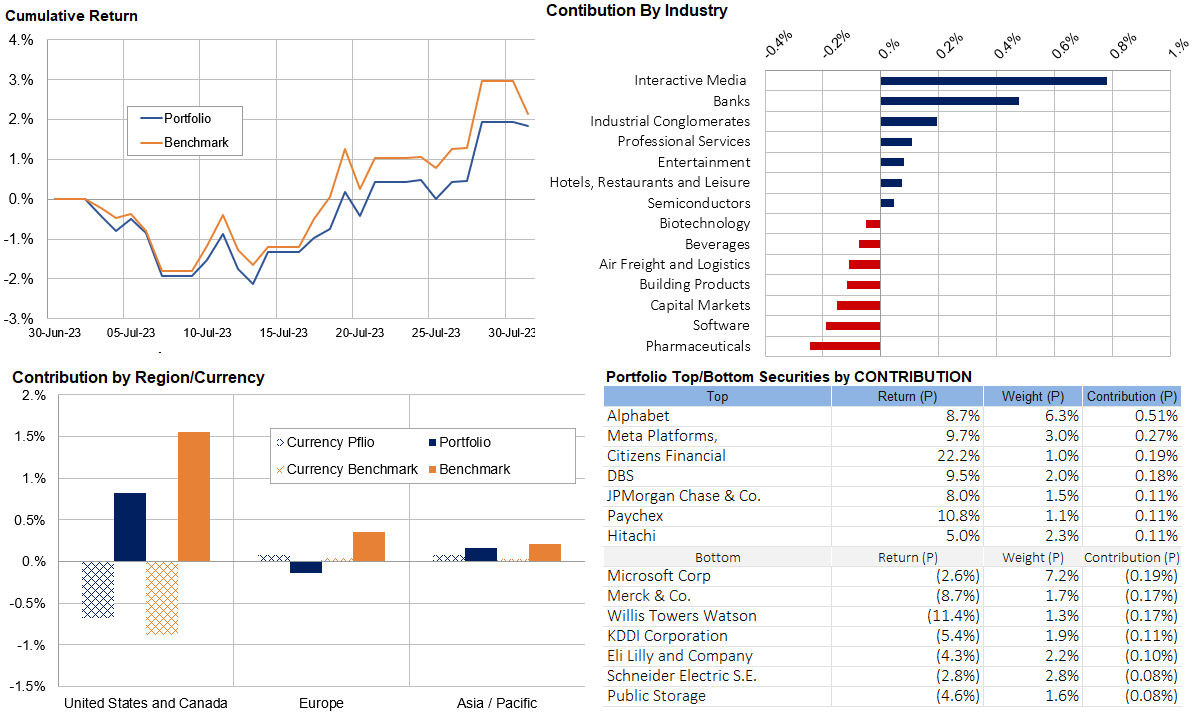
Core International Performance
July started in the red but finished positively as US earnings met their slightly lowered expectations and there are still no signs of a recession. Our portfolio tracked the benchmark but the continued surge in the AI stocks meant we trailed at toward month end. Regionally our European exposures underperformed after last month’s overperformance and the continued AI focus meant our US portfolio trailed. The strengthening AUD vs USD detracted from US returns. We have maintained our portfolio composition at this stage.
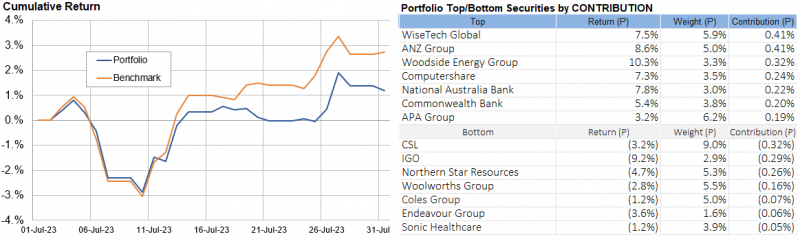
Core Australia Performance
Australian equities tracked global indexes. We underperformed the benchmark after last month’s overperformance as we are underweight Banks and Energy which had a strong end to the month.
Portfolio Yields
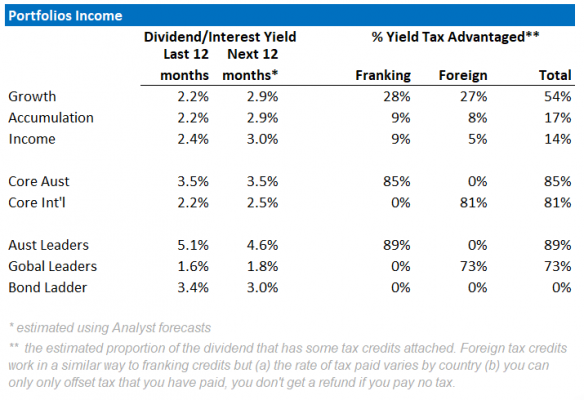
This table shows the income yields of our various portfolios, including their proportion of Franking and Foreign tax paid over the past 12 months. We also include an estimate of forecast yield (next 12 months), assuming no change in current tactical allocations and stock composition. Most portfolio yields are expected to rise with greater income contribution from cash and bonds with the global interest rates rises. However, Australian equity yields may fall as commodity-driven mining companies are expected to have lower profits to pay out. Our underweight Resource position in Core Australia portfolio should help maintain its yield.