
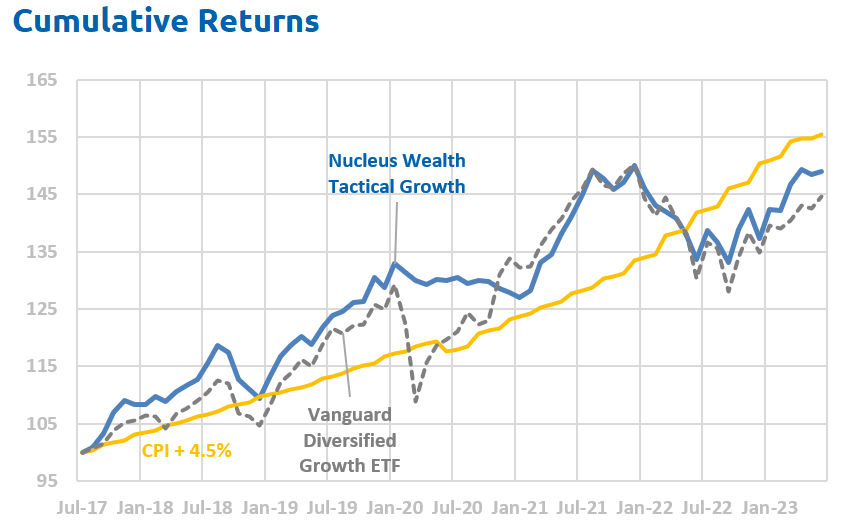
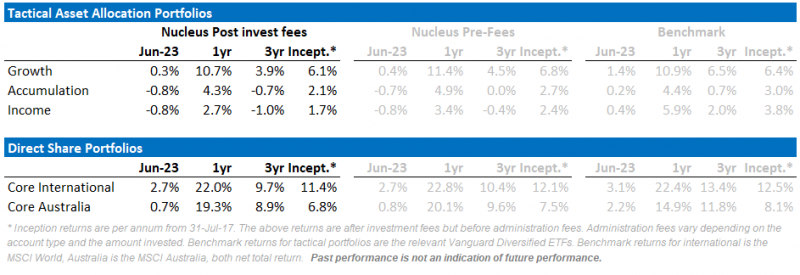
During the year to June, our Core Australian equity portfolio significantly outperformed the benchmark, ranking in the top 5 large-cap Australian funds, bolstered again by our defensive and underweight resources and bank stock exposures. In the most recent month, these weights led to slight underperformance. Our international portfolio also outperformed the benchmark by 1.2% over the last year but underperformed in June, mostly because of the defensive nature of the stocks that we own. Our tactical portfolios underperformed as bonds pulled back this month, and performed in line with the market over the last year with considerably lower volatility than their benchmarks.
Looking forward, we expect weak stock markets as the central banks raise rates to slow demand, shrinking company profits.
With that in mind, the key factor to watch in the coming months to tell if we are wrong or right is the change in corporate profitability. The recent reporting season in the US showed some signs of weakening earnings, but not enough to confirm our thesis yet. Earnings forecasts have been drifting lower.
Interest rates vs the three booms
Investment markets are in the middle of an epic showdown. In the bearish camp:
- Higher interest rates
- Weakening earnings
- Increasing bankruptcies
In the bullish camp:
- A strong US job market
- The promise of an artificial intelligence boom
- The promise of a US capex boom
In the past few months, stock markets have boomed. There is clearly an expectation that the bullish factors outweigh the bearish ones. Over the next five years, I believe in a reasonable amount of the hype. Artificial intelligence will spark a productivity boom in many sectors. A US government with an actual industrial policy, after decades of not having one, will create a capex boom. But, these are both longer-term trends that will be overwhelmed in the next 12 months by the effects of higher interest rates.
This month, I’m going to focus on the artificial intelligence market.
How big can artificial intelligence be in the long term?
In the longer term, the sky is the limit. The best analogy is likely the introduction of the internet or the personal computer into workplaces. Artificial intelligence will allow more to be done with fewer workers in a vast array of industries.
This means higher growth, maybe 0.5-1.0% earnings/GDP more over the course of a decade or more. That is a significant economic factor. The question is how much to pay for it now.
How big can artificial intelligence be in the short term?
I look at this in a number of ways below. Each time, I struggle to find more than a few hundred billion in spending.
Significant? Absolutely.
Enough to rescue a $100 trillion dollar economy from the effects of higher interest rates? I’m a lot more skeptical.
Also, a lot of this spending could be classified as “stay in business” capital expenditure. Say you don’t spend money on artificial intelligence, but your competitors do. If your competitors can then lay off staff and lower costs, you might no longer be able to compete. Net effect of this type of spending is that companies lower costs, but also lower sales. It is good for society as companies can do more with fewer resources. But for individual companies, profits don’t change much.
Private investment in artificial intelligence
I’m using NetBase data for this:
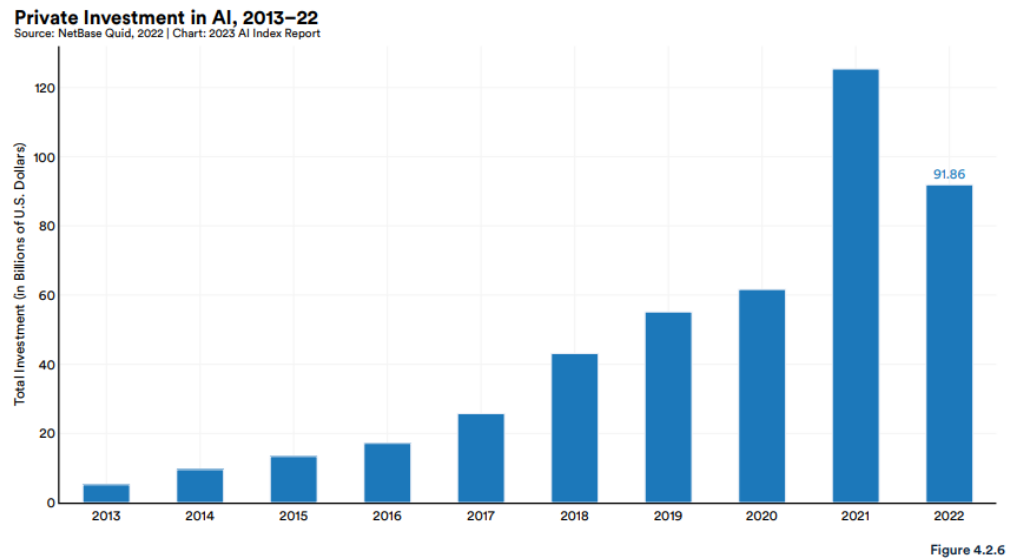
It is hard to know how accurate this data is. It seems credible, but my guess is that over the next few years there are going to be lots of job title changes to make it sound like there is some involvement in artificial intelligence. So, some of the extra “spending” is going to be bullshit. I stop calling my offsider an analyst and start calling them a data scientist. I rename a statistician to a machine learning specialist. They get a salary bump, and I get to tell my shareholders what a good job we are doing. I’m not spending any more, I’m just re-classifying.
Secondly, the NetBase AI investment data fell by 30% in 2022. The most likely explanation is that there were a lot of SPACs and venture capitalists raising money in 2021. And then that disappeared into 2022. If NVIDIA is any guide, a lot of this money will be back in 2023.
Then we need to take out any spending by China. Chinese companies are banned from using the most advanced US technology and so for listed companies, China is unlikely to be a significant source of sales. If we average 20221/22, take out China then we are starting with a market size of about $100 billion. Let’s be aggressive. Say this can go to $300b in short order.
So we are talking about an extra $200b in spending on artificial intelligence.
Keep in mind also that AI is very compute intensive up front, but applying the model is much simpler. It is similiar to calculating a regression. The hard work is creating the formula, say y = 1.3 + 2.1x. Once you have the formula, calculating y from a given x is much simpler.
The issue I have is that most of the money is going to go on staff. My estimate is that you are probably spend around 70-90% of money on salaries and other expenses, vs 10-30% on running tests. This same report suggests already that 2% of job ads in the US are for roles that could involve AI:
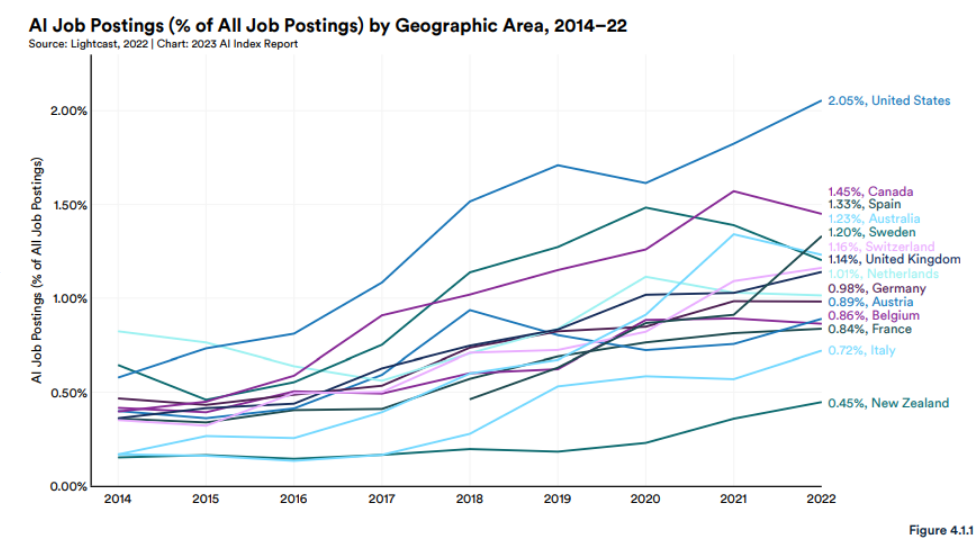
Sometimes assuming most of the spend will be on salaries will be the wrong assumption. If you need to ingest the entire internet for your model, then you will need to spend tens of millions on processing. On the other hand, Goldman Sachs just patented an AI model to interpret whether communications from the Federal Reserve are hawkish or dovish. That is a limited dataset. You are probably running that analysis on your own laptop. i.e. spending $0 on (additional) computing power.
My observation is that most companies are going to rely on tools where the bulk of the training has been done by others. Then, they will use that data on their own, much more limited datasets.
So, of the extra $200b, we are talking say $40-50b on computing costs. But that isn’t all going to the chip manufacturers. Deduct the profit margin of data centres, memory, storage, power, data centres, infrastructure staff and equipment. Chip manufacturers might end up with a little more than half, say $25-30b. Great work if you can find it, but hard to see how it moves the needle much of total world profits of $60,000b.
US information technology jobs are not suggesting a spending boom
The most recent data that we have says that US information technology jobs are going backwards still:
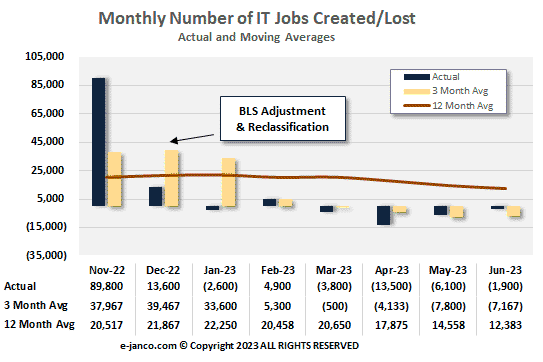
Is it possible to have an artificial intelligence boom while employing fewer information technology workers? Seems unlikely.
There probably is a boom coming in spending on artificial intelligence. But, as far as I can tell, companies are very much in the exploration stage. They want to spend money, they just don’t know where yet and are probably going to spend the next 12 months or so trying to work it out.
Data centre capex
The other way to attack the market size is to look at existing spend at data centres and scale up from there.
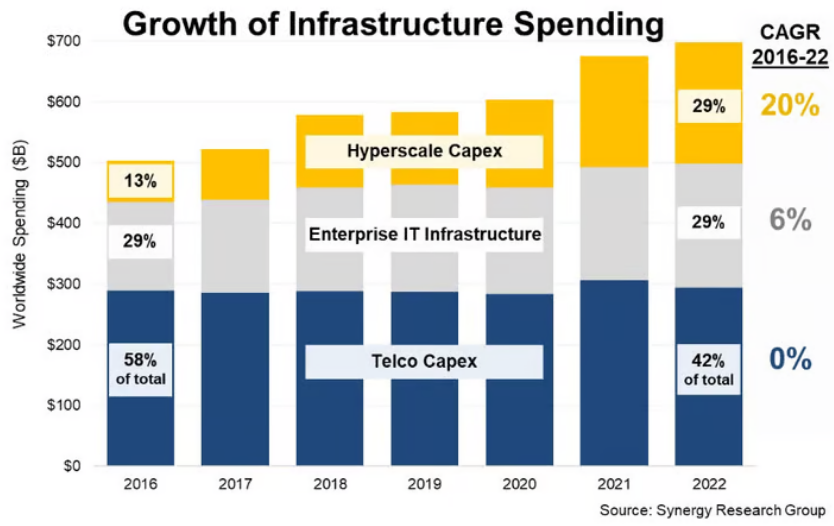
I’m assuming the enterprise IT and telco capex aren’t going to be meaningfully affected. This is mostly about compute, not data transmission.
This means we start with $200 billion on Hyperscale capex per year. Again let us be really, really aggressive. Say capital expenditure goes to $500 billion in short order i.e. 150% higher at +$300 billion.
Of this spend, 50-60% goes to data centres. Say $175 billion.
Data centres make 30%+ margins. And I’m guessing if there was a doubling of demand the margins would be higher. Ignore that though, say we still have $125 billion to spend.
Of that spend, 55-60% goes on servers, and the rest on power, networking, staff, infrastructure, rent etc. So, $75 billion to spend on servers.
So, again there are significant gains for the companies within the sector. But, the spending is just not that large relative to the size of the economy. Further, the biggest impacts are going to be on Microsoft, Google and Amazon, all of which are extremely large companies. The effect on those companies will be positive, especially for Amazon, but won’t be transformational.
AI company investment options
Keep in mind for most of the companies below, AI is a subset of what they do, not the main game. Yet.
There are effectively four layers to consider:
Software providers:
These companies produce the software that others will use. I suspect these will end up a bit like browsers on the internet, largely free to consumers. Effectively paid for from advertising or lock-in to cloud services. Likely to be some (expensive) high-end models provided to big companies for private use.
The only real players currently are Alphabet (Google) and OpenAI (unlisted, partly owned by Microsoft). There are hundreds of companies trying to sell add-ons or alternative products.
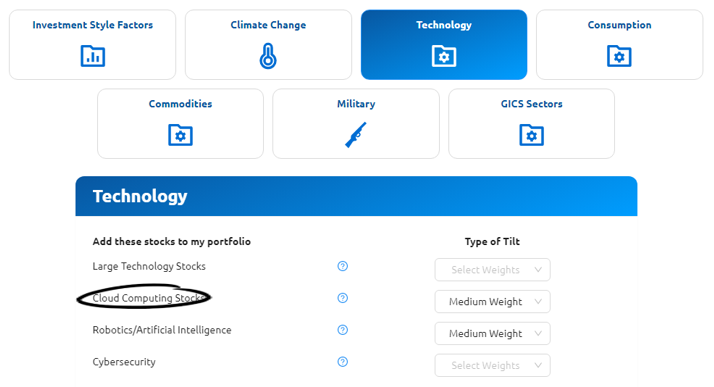
Cloud Infrastructure:
The infrastructure needed to run the advanced models is quite specialised. It makes sense to rent the equipment rather than buy your own in most cases. Which means lots more money spent on cloud computing providers.
The big players are Alphabet (Google), Amazon and Microsoft.
For Nucleus Wealth clients – choose a Cloud Computing as a “tilt” to your portfolio to get an additional weight to a basket of these stocks:
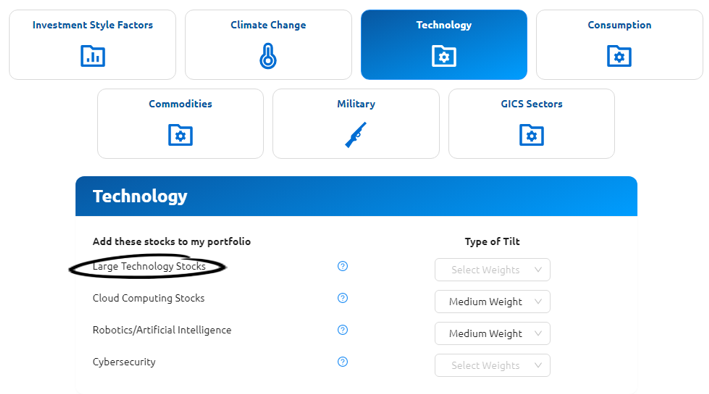
Processing:
The hardware, software and networking to run AI models. This is where NVIDIA dominates. It operates across all elements, as does Google. Amazon is having a go at the hardware, likewise AMD. In the system and networking, Broadcom shouldn’t be overlooked. In the software (supplying libraries that AI models will use), Google, NVIDIA and OpenAI are the main players.
For Nucleus Wealth clients – choose large technology stocks as a “tilt” to your portfolio to get an additional weight to a basket of these stocks:
Then there are the indirect beneficiaries. TSMC and GlobalFoundries are the obvious winners, as is ASML who supply high end equipment that makes the equipment. The memory chip companies, Micron, SK Hynix, Samsung will likely benefit. More so if there are lots of lower end machines sold rather than a small number of supercomputers.
Consultants:
Not really a major thing just yet. But it is coming. IBM, Accenture, Cognizant, Capgemini and others will gladly take the money of those who are late to the party and need to put “AI” in their next annual report or press release.
Upshot of the effect on markets
Artificial intelligence will undoubtedly make the world more efficient. It is likely to increase profits. Will it bail out company profits in the next year? I highly, highly doubt it.
Quick economic wrap up
- Jobs data in the US is still strong. Australian data looks to be peaking.
- Forward indicators continue to suggest recession.
- Earnings data remains weak. Analysts are forecasting a drop of almost 10% in June quarter earnings, but still have growth of 10% in December earnings. We expect downgrades over the next month.
- Credit growth is very low
- Chinese growth is very low. There are hopes of stimulus, but, best I can tell, the stimulus will do little for commodities.
Net Effect
The credit crunch is growing, bankruptcies are climbing, company earnings are sliding lower, and China is not coming to the rescue.
Valuations are in the most expensive 20% of historical ranges. None of those factors encourage me to buy more stocks.
Jobs are the lone bright spot. They are usually the last domino to fall, so it is not atypical at this point in the cycle to see jobs yet to weaken. But the continued strength of jobs and wages is the one factor that bears could prove bears wrong.
Investment Outlook
I have some pretty clear ideas about which trends are sustainable and which ones aren’t in the long term. However, the short-term is far less clear:
- The banking crisis is morphing into a credit crunch. This is the number one issue over the next few months.
- The sanctions on Russia are unlikely to be lifted anytime soon. The short-term effect was commodity shortages. In the longer term, it seems likely that we will see a re-orientation, Russia will supply more to countries like China and India, less to Europe. For some commodities (oil, wheat) this will be easier. For others (gas) it will be extremely difficult.
- The geopolitical energy crisis in Europe has eased on the back of much warmer weather. Australian energy price caps have pushed down energy prices. There will be a rush to alternative energy sources in the mid-term.
- Supply chains continue to improve.
- Governments continue to withdraw (or not replace) stimulus. There will be a fiscal shock into 2023. The question is whether the private economy will be strong enough to withstand it. Leading indicators suggest profits will be lower.
- Central banks have made it clear that they will try to solve the Russian-induced energy issues and supply chain-induced inflation by raising interest rates. The odds of a policy error have increased significantly.
- China still has not bailed out the property sector. Last year’s changes are not a bailout… but they may morph into one. China is trying to ensure that houses under construction get built, small businesses have access to credit, infrastructure building continues, and failing developers do not crash the economy. China is yet to show any signs of turning back to the old days of debt-driven property developer excesses. If China doesn’t continue to roll out new measures, the commodity market will deflate again.
It is still not the time for intransigence. Events are still moving quickly. But we have positioned the portfolio towards the most likely outcome and are gradually increasing the weights as more data arrives.
Bond yields have risen significantly. If the world heads for a recession this is a buying opportunity. In the short term the narrative “high inflation, central banks raising rates = sell bonds” seems to be coming to an end. Although there may be another last hurrah as the US central bank looks to rein in the stock market optimism.
The mix of higher volatility, leading to deleveraging of risk parity trades and momentum means yields could yet go higher. We are invested for bond yields to reverse.
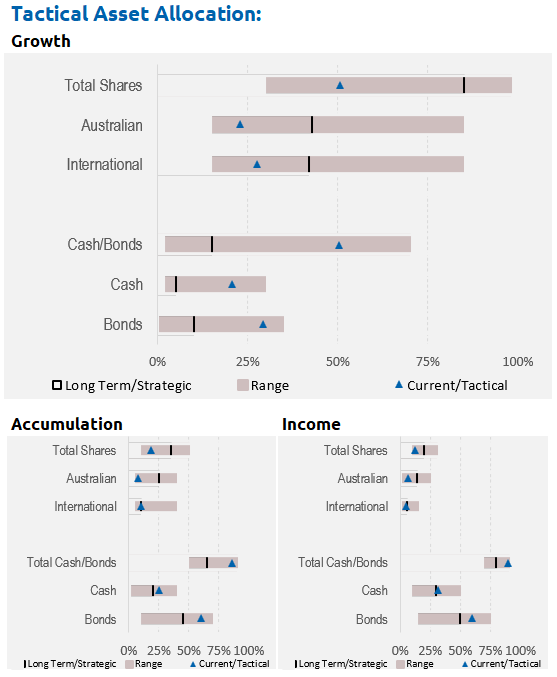
Asset allocation
After being very expensive for a number of years, stock markets are now merely expensive, in 85th percentile by value. Debt levels are extremely high. Earnings growth had been really strong but has come to a halt. There are signs it is starting to reverse.
Markets are supported to a great degree by central banks and governments. Policy error is every investor’s number one risk.
But, any number of other factors could force this off course and see unexpected inflation. Energy prices could jump higher, increasing inflation. Chinese/developed world tensions might rise further, leading to more tariffs. Or, China might decide again to supercharge property investment.
We are significantly underweight Australian shares, and as noted above, overweight bonds, with the view that the Australian market is more quickly affected by rising interest rates and more affected by a global recession:
Performance Detail
Core International Performance
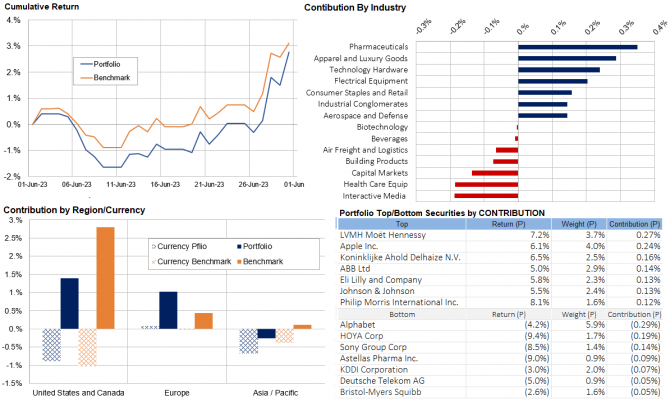
Over June, global equities bubbled along, underwater for most of the month but finished strongly. Our portfolio tracked below the benchmarks most of the month but narrowed the gap toward month-end. Regionally for us, Europe was the key driver as Luxury Goods and Pharmaceuticals had a strong rebound month. Our US stocks underperformed owing to poor month by Google, our preferred exposure to AI/Interactive Media. The strengthening AUD detracted from most returns except in Europe.
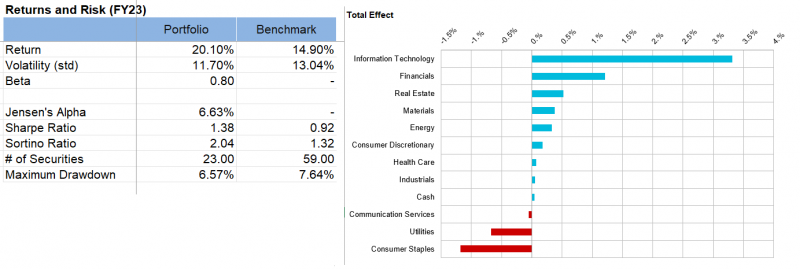
With financial year end we took a look at FY23 performance.
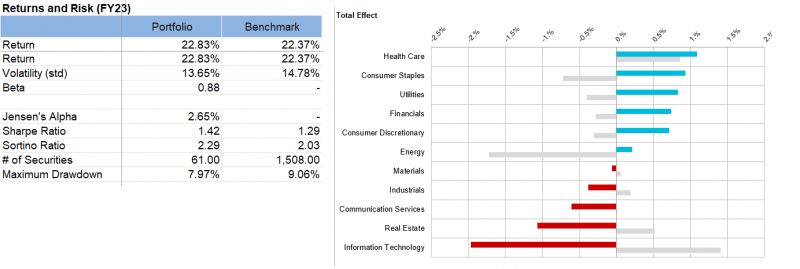
Total effect shows where we out/underperformed the benchmark index, be it via sector allocation or stock picking (Grey denotes our FY22 results). While Infomation technology was a key contributor to our strong return, it remained below Index contributions and reversed last year’s positive contribution. Conversely, Health Care has been a key contributor over the past two years. The almost 0.5% outperformance was also achieved with lower volatility, Beta, less Maximum drawdown and better risk measures (Sharpe & Sortino ratios), overall in keeping with our lower risk/return ethos.
Core Australia Performance
Australian equities ended up during a volatile month with technology continuing its rise and commodity stocks recovering. After last month’s adjustments, there were no changes this month.
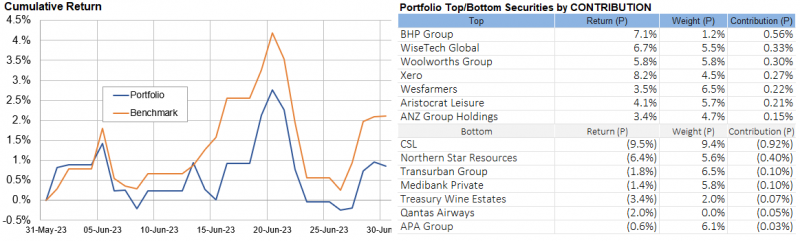
We also took a look at FY23 yearly performance.
Our overweight Technology and underweight Financial this financial year proved the correct strategy, but our overweight Defensives detracted. Similar to the Core International portfolio we outperformed (strongly!) with lower risk measures.
Portfolio Yields
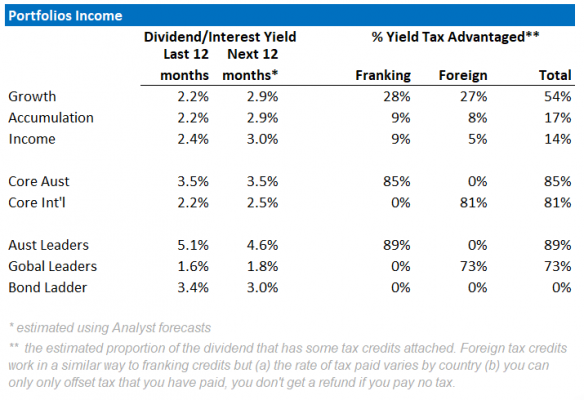
This table shows the income yields of our various portfolios, including their proportion of Franking and Foreign tax paid over the past 12 months. We also include an estimate of forecast yield (next 12 months), assuming no change in current tactical allocations and stock composition. Most portfolio yields are expected to rise with greater income contribution from cash and bonds with the global interest rates rises. However, Australian equity yields may fall as commodity-driven mining companies are expected to have lower profits to pay out. Our underweight Resource position in Core Australia portfolio should help maintain its yield.